Jon Harmon (he/him/his)
@jonthegeek.com
5.9K followers 1K following 510 posts
🗣️#RStats #DataScience #Dogs @dslc.io Executive Director
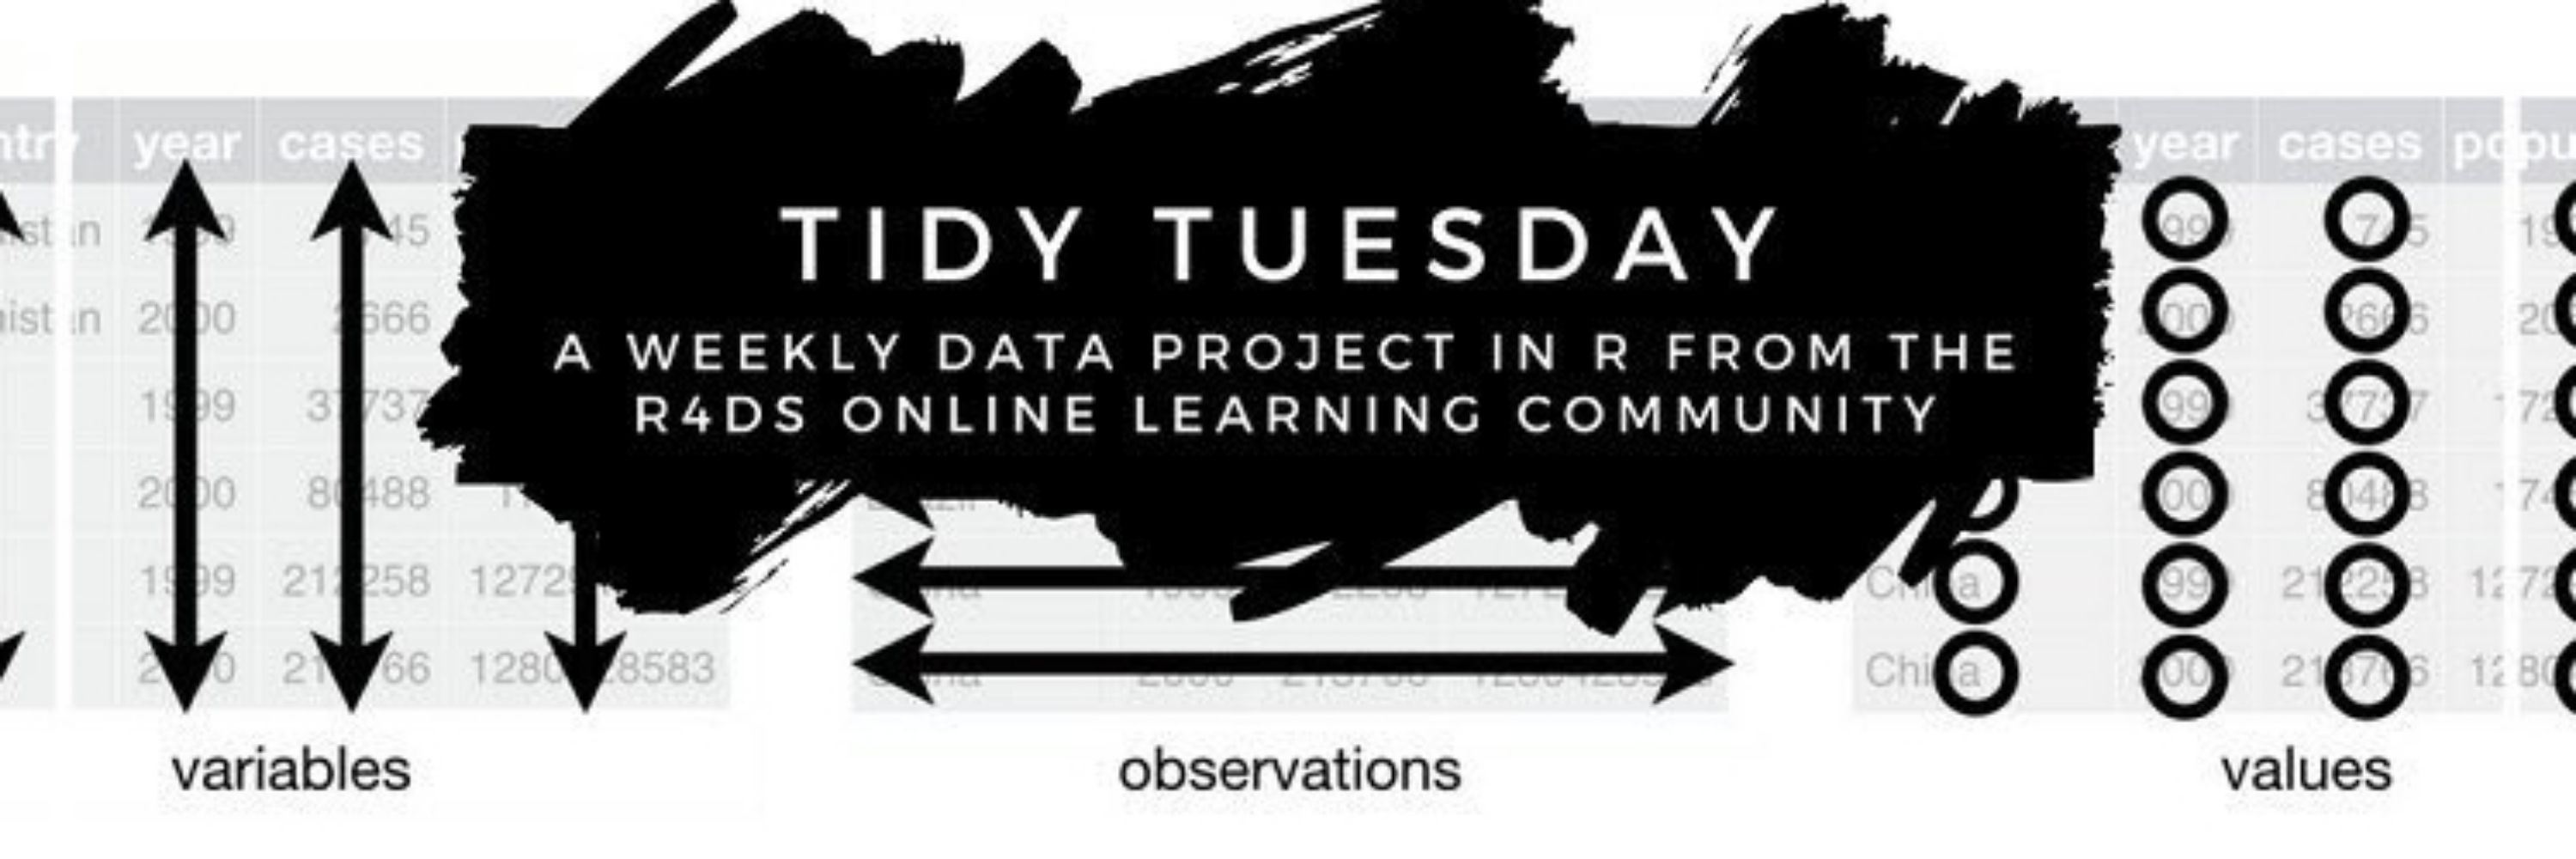
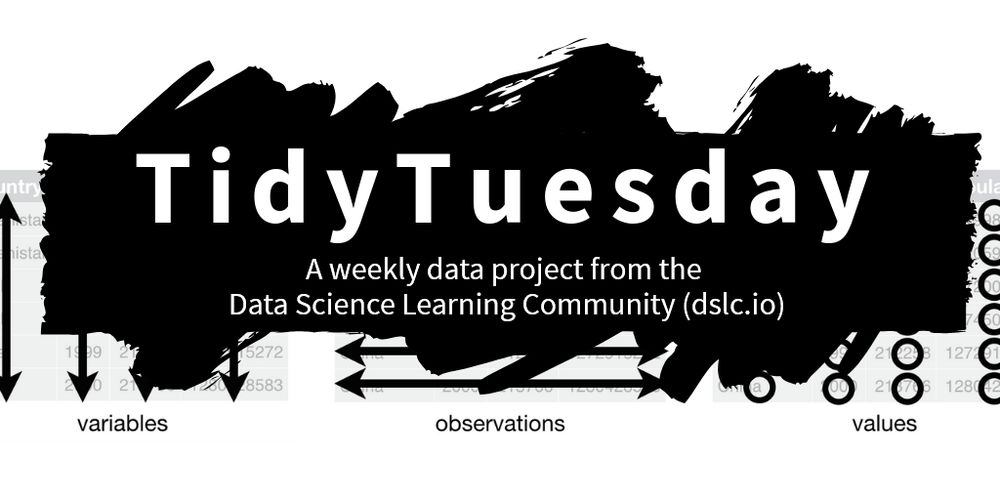
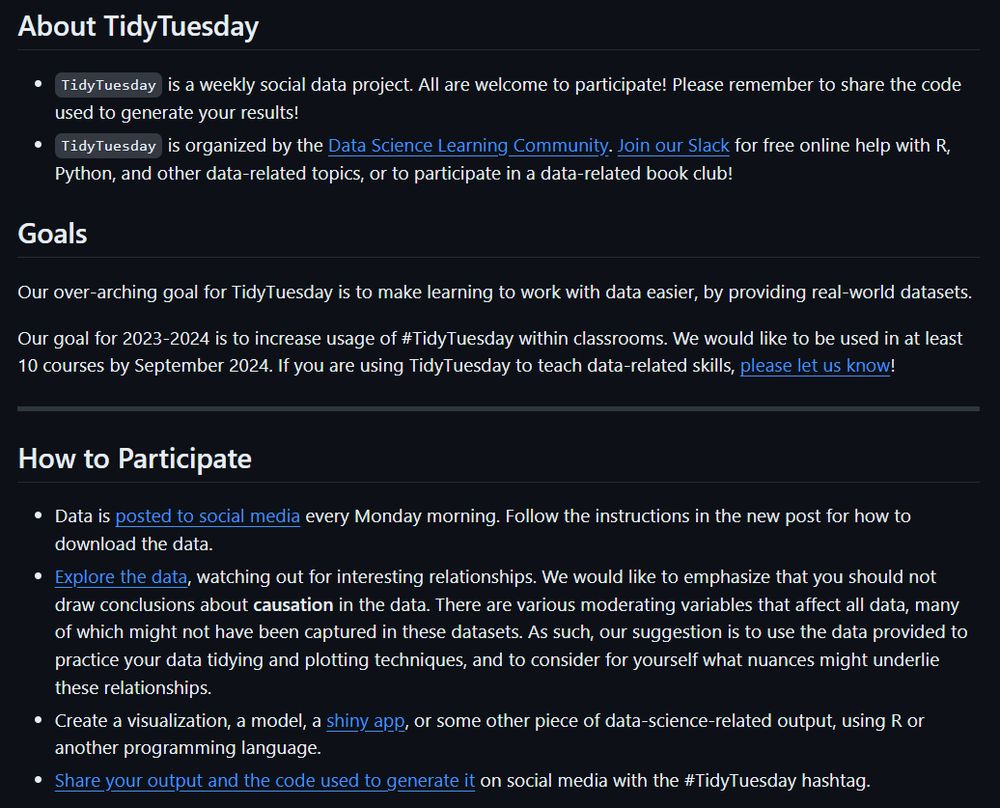
 #TidyTuesday poster 🔗http://linkedin.com/in/jonthegeek 🔗http://github.com/jonthegeek
Posts Media Videos Starter Packs
jonthegeek.com
@dslc.io welcomes you to week 40 of #TidyTuesday! We're exploring EuroLeague Basketball!

📁 https://tidytues.day/2025/2025-10-07
🗞️ https://en.wikipedia.org/wiki/EuroLeague

#RStats #PyData #JuliaLang #DataViz #tidyverse #r4ds
Logo for the #TidyTuesday Project. The words TidyTuesday, A weekly data project from the Data Science Learning Community (dslc.io) overlaying a black paint splash. TidyTuesday is a weekly social data project. All are welcome to participate! Please remember to share the code used to generate your results!
TidyTuesday is organized by the Data Science Learning Community. Join our Slack for free online help with R and other data-related topics, or to participate in a data-related book club!

 How to Participate
Data is posted to social media every Monday morning. Follow the instructions in the new post for how to download the data.
Explore the data, watching out for interesting relationships. We would like to emphasize that you should not draw conclusions about causation in the data.
Create a visualization, a model, a shiny app, or some other piece of data-science-related output, using R or another programming language.
Share your output and the code used to generate it on social media with the #TidyTuesday hashtag. Lollipop chart showing the seating capacities of EuroLeague arenas by team.
Reposted by Jon Harmon (he/him/his)
rpodcast.bsky.social
Episode 212 of R Weekly Highlights is out! serve.podhome.fm/episodepage/...

🦆 Jumping in Ducklakes @novica.bsky.social
🎨 Slidecrafting book! @emilhvitfeldt.bsky.social
🤖 Shiny side of LLMs @veerle.hypebright.nl

And a favorite segment returns 😅

h/t @mike-thomas.bsky.social 🙏

#RStats #databs
novica.bsky.social
jonthegeek.com
As of yesterday, what I think of as my "Bonsai Tomatoes" have been growing in my Aerogarden for a full year. They still produce tomatoes (I just harvested, so you can't see any red in the photo), but, more importantly, they still produce a ton of leaves, which I can trim to enter a meditative state.
Tomato plants growing in an aerogarden hydroponic garden. A pair of gardening scissors are poking in from the side, ready to prune leaves.
jonthegeek.com
@dslc.io welcomes you to week 39 of #TidyTuesday! We're exploring Crane Observations at Lake Hornborgasjön, Sweden (1994–2024)!

📁 https://tidytues.day/2025/2025-09-30

#RStats #PyData #JuliaLang #DataViz #tidyverse #r4ds
Logo for the #TidyTuesday Project. The words TidyTuesday, A weekly data project from the Data Science Learning Community (dslc.io) overlaying a black paint splash. TidyTuesday is a weekly social data project. All are welcome to participate! Please remember to share the code used to generate your results!
TidyTuesday is organized by the Data Science Learning Community. Join our Slack for free online help with R and other data-related topics, or to participate in a data-related book club!

 How to Participate
Data is posted to social media every Monday morning. Follow the instructions in the new post for how to download the data.
Explore the data, watching out for interesting relationships. We would like to emphasize that you should not draw conclusions about causation in the data.
Create a visualization, a model, a shiny app, or some other piece of data-science-related output, using R or another programming language.
Share your output and the code used to generate it on social media with the #TidyTuesday hashtag. Large flock of cranes gathered in a grassy field during golden hour, with some birds in flight overhead and autumn-colored vegetation in the background.
Line chart showing the number of cranes per day at Lake Hornborga in Sweden during March and April from 2014-2021. Multiple gray lines represent different years, with the 2018 and 2021 seasons highlighted in blue. The chart shows crane migration patterns starting near zero in early March, building to peak numbers of 15,000-27,000 birds between March 30 and April 8 (highlighted in beige), then declining through late April. The highest recorded count was 27,300 cranes on April 3rd, 2019. Dashed lines indicate days when weather conditions made accurate counting difficult. A note explains that 2018 had unusually cold February temperatures causing later arrival. The chart is credited to Anna Thieme from Länsstyrelsen VG at https://transtat.lansstyrelsen.se/
jonthegeek.com
At the time it felt like something was being set up but then I forgot about it. I'm curious if @scalzi.com also expected it to come back around sooner...
jonthegeek.com
Ohhhhh! I'm reading The Shattering Peace by @scalzi.com , and got to the Big Sci-fi Idea, and just remembered thinking that something like this story would have to happen eventually when the Old Men discussed the underlying tech ~20 yrs ago! I'd completely forgotten that's how they worked! ☺️
Reposted by Jon Harmon (he/him/his)
lls-d.bsky.social
Had some fun with today's #TidyTuesday dataset! Here is an annotated streamgraph displaying chess players' age versus title.
jonthegeek.com
Ctrl-shift-f10 (to restart R) before you run if you want an empty environment. That actually gets everything. rm(list = ls()) misses things that start with .
Reposted by Jon Harmon (he/him/his)
jonthegeek.com
@dslc.io welcomes you to week 38 of #TidyTuesday! We're exploring FIDE Chess Player Ratings!

📁 https://tidytues.day/2025/2025-09-23
📰 https://www.fide.com/fide-september-2025-rating-list-vincent-keymer-debuts-in-top-10-open/

#RStats #PyData #JuliaLang #DataViz #tidyverse #r4ds
Logo for the #TidyTuesday Project. The words TidyTuesday, A weekly data project from the Data Science Learning Community (dslc.io) overlaying a black paint splash. TidyTuesday is a weekly social data project. All are welcome to participate! Please remember to share the code used to generate your results!
TidyTuesday is organized by the Data Science Learning Community. Join our Slack for free online help with R and other data-related topics, or to participate in a data-related book club!

 How to Participate
Data is posted to social media every Monday morning. Follow the instructions in the new post for how to download the data.
Explore the data, watching out for interesting relationships. We would like to emphasize that you should not draw conclusions about causation in the data.
Create a visualization, a model, a shiny app, or some other piece of data-science-related output, using R or another programming language.
Share your output and the code used to generate it on social media with the #TidyTuesday hashtag. FIDE Rating List Top 10 as of September 1, 2025. At the top of the graphic, three players are featured prominently. Magnus Carlsen of Norway in first place with a rating of 2839, Hikaru Nakamura of the United States in second with 2807, and Fabiano Caruana of the United States in third with 2789, marked with a green +5 for his recent rating gain. Below them, the list continues. Fourth is Praggnanandhaa R of India with 2785 (+6), fifth is Arjun Erigaisi of India with 2771 (–5), sixth is Gukesh D of India with 2767 (–9), seventh is Wesley So of the United States with 2756 (+11), eighth is Alireza Firouzja of France with 2754 (–12), ninth is Wei Yi of China with 2753, and tenth is Vincent Keymer of Germany with 2751 (+21). The left side of the graphic features the FIDE logo and text reading 'FIDE Rating List Top 10' and 'September 1, 2025' in yellow on a black background.
Reposted by Jon Harmon (he/him/his)
jonthegeek.com
This just got a like 2 years later, so, if you're reading this, it's @dslc.io now!
jonthegeek.com
I thought maybe I was using a too-expensive model, but nope, I was using the tied-for-cheapest that's available in Positron Assistant.

I was just kinda shocked. I was expecting such a short session to be closer to $0, so the month would come out closer to $25 than to $100.
jonthegeek.com
I played around with Positron Assistant a bit this morning. Do y'all spend a LOT of money on these things? I spent $0.70 In 20 minutes debugging an issue the way I would in a $20/month chat on non-API Gemini. I could easily burn through my monthly spend today. Is avoiding copy/paste worth that much?
Reposted by Jon Harmon (he/him/his)
jonthegeek.com
Houston is probably giving lots of incentives and guarantees to counteract the harm being done by the state. I'm sure Austin is doing the same right now. Still wouldn't recommend. 😕
jonthegeek.com
Got my glass of🍷and walked into the community mixer... And got ~claustrophobic. That room is waaaaaay too small for this group. I'm curious if anybody has a CO2 meter and can see how bad it is. Think I'll head elsewhere in any case, unfortunately! See some of you tomorrow at dev day! #PositConf2025
jonthegeek.com
2026 will be cheap for me (drive not fly), but I still would have preferred we all go to a different state 🙃
jonthegeek.com
Looks like I'll see y'all in Houston next year for #PositConf2026! Note: much like Austin, Houston isn't IN Texas so much as (almost) SURROUNDED BY Texas. I can understand if certain insane and evil policies of our government keep people away, though! #PositConf2025
Posit conf 2026 will be in Houston and virtual Sept 14-16, plus a European version TBD
jonthegeek.com
My guess is Detroit for #PositConf2026. #PositConf2025
Reposted by Jon Harmon (he/him/his)
libbyheeren.bsky.social
Want to have a built-in circle of data buddies at the next conference you attend?! Go to community events online!! @jonthegeek.com & I were talking about how our circles online, like the DSLC book clubs & the DS Hangout, let us get to know lots of folks online before seeing them in person <3 #databs
jonthegeek.com
A side benefit of DSLC.club book clubs is you get to know a handful of data nerds pretty well and have your group at conferences 😁
Book Clubs – dslc.io
DSLC.club
jonthegeek.com
bsky.app/profile/jont...
"Making the most of artificial and human intelligence for data science" by @hadley.nz and @jcheng5.bsky.social

Balance between hype and skepticism. I need to play with the Posit tools and see what I think. Their assistants are Anthropic-only right now, but that's prob ok.
jonthegeek.com
After a bit of a break, I'm back for "Making the most of artificial and human intelligence for data science" by @hadley.nz and @jcheng5.bsky.social. I know one little piece of this one, but I'm interested to hear what they have to say!

#PositConf2025 #RStats
jonthegeek.com
bsky.app/profile/jont...
"shinystate: Launching collaboration and session management to new heights in Shiny applications" by @rpodcast.bsky.social

Slides: rpodcast.github.io/shinystate-p...

rpodcast.github.io/shinystate/ on its way to CRAN. Definitely another one I *might* have uses for!