John Lovell
@jotlovell.bsky.social
690 followers 370 following 89 posts
Helping to make genomics useful for crop improvement, ecology, evolutionary biology, and conservation HudsonAlpha Genome Sequencing Center and DOE Joint Genome Institute
Posts Media Videos Starter Packs
Reposted by John Lovell
Do you know ~60% of human SVs fall in ~1% of GRCh38? See our new preprint: arxiv.org/abs/2509.23057 and the companion blog post on how we started this project and longdust: lh3.github.io/2025/09/29/o.... Work with Alvin Qin
jotlovell.bsky.social
Just an outrageous amount of structural variation in pennycress. While not yet reproductively isolated, its likely these shredded pericentromeres contribute to some reproductive incompatibilities.
stairwaytokevin.bsky.social
Whole-genome alignments revealed pennycress has nearly dichotomous genome compartmentalization: huge gene-poor pericentromeric regions (~300Mb; <1% genic) with frequent rearrangements and highly syntenic gene-rich chromosome arms (~150Mb; ~20% genic). What we call a "two-speed" genome structure. 3/
Figure 3 | Macrosynteny and genome structure across the Brassicaceae. Horizontal blue/black/orange bands represent the chromosomes of Arabidopsis thaliana, A. lyrata, MN106, and Brassica rapa (top to bottom). Chromosomes are ordered by their number from left to right. Colors represent genomic content binned hierarchically in sliding windows (400kb-overlapping 500kb) as follow: (1) within a gene annotation (including intron and UTR, orange), (2) within EDTA-annotated repeats categorized as Ty3, (3) Ty1 (copia), (4) within another repeat category, or (5) un-annotated. Grey bands are sequence-based syntenic blocks between each pair of genomes. Pennycress and B. rapa are phylogenetically proximate (both in Brassicodae supertribe), but have reduced synteny in part because of genome reshuffling in B. rapa following a whole-genome triplication event. The seven pennycress genome assemblies (horizontal bars) are binned into TRASH-defined centromeres (orange), pericentromeres (dark blue), chromosome arms (light blue) and telomeres (dark red). The colors along the chromosome segments scale physically with the size of the bin, except that centromeres and telomeres have a 1pt buffer to make it easier to see these typically small regions. Each genome is connected to its neighbor by grey polygons that represent sequence-based syntenic blocks. Plots, genomic bins, and syntenic blocks were built with DEEPSPACE (github.com/jtlovell/DEEPSPACE).
Reposted by John Lovell
wormsrock.bsky.social
C. elegans is a real animal and we set out to understand how it comes to have its distinctive biogeography. Its ancestral center of diversity is in the higher elevation forests of Hawaii. Its closest relatives are spread across east Asia. Did they travel from Asia? [Preprint 🧵]
Reposted by John Lovell
carriewessi.bsky.social
Don't forget to apply to our position in Evolutionary Genetics at U of South Carolina!

In my experience it is a fantastic place to start a new lab, with friendly and supportive colleagues and many junior faculty in EEB!

Review starts in 1 week (Oct 1)!
carriewessi.bsky.social
Please repost and amplify !

We are hiring a faculty position in Evolutionary Genetics in the Biology Department at U of South Carolina!

Check us out and come be our colleague!
sc.edu/study/colleg...

Deadline for applications is Oct 1

#AcademicJobs #EvoBio
Assistant Professor position in Evolutionary Genetics - Department of Biological Sciences | University of South Carolina
sc.edu
jotlovell.bsky.social
I haven’t slept for seven days either … that would be too long
Reposted by John Lovell
cbo.bsky.social
And yes, now is the right time.

New for @undark.org

"The fundamental problem with the tenure process is that it has struggled to recognize that knowledge is curated, created, and consumed differently today than even a decade ago."

undark.org/2025/09/11/o...
It’s Time to Rethink the Academic Tenure Process
Opinion | To fight the war on science, higher education needs to reimagine the most important career milestone for faculty.
undark.org
jotlovell.bsky.social
Very nice! Thanks for the link.
This is something you find when you dig deep enough. We've been looking for ways to harmonize annotations since we saw a similar pattern among pecan genomes in 2021 (buried in the SI tho). www.nature.com/articles/s41...
jotlovell.bsky.social
We can try it, but my guess is way worse. So many false positives.
jotlovell.bsky.social
So, tl;dr: gene PAV and CDS variation is highly dependent on annotation method. Carefully choose, re-annotate, and integrate your pangenome if you want to trust the results

Preprint led by @tomasbruna.bsky.social, Avinash Sreedasyam, and @avril-m-harder.bsky.social. Support from @jgi.doe.gov.
jotlovell.bsky.social
Furthermore, even within fully present ('core') gene families we noticed a disturbing trend — identical sequence was not annotated with identical gene structures 20-50% of the time w/in annotation methods and 40-70% of the time btw methods
IGC-reannotation is not perfect, but reduces this to 5-15%
jotlovell.bsky.social
But what about within methods? Is using the same method enough to trust PAV? The answer here is less obvious, but method clearly matters.

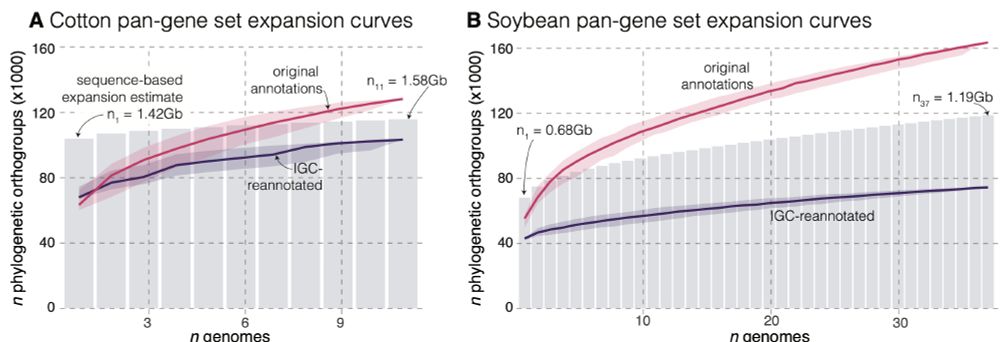
Within two groups that annotated 7 and 23 soybean genomes there were 3x & 2x more PAVs than IGC — these pangenomes are not as 'open' as reported.
jotlovell.bsky.social
These results clearly show that 'naive' integration of existing annotations is not a good idea, especially among genomes that were annotated with similar but not identical methods.
jotlovell.bsky.social
In other words, while gene PAV similarity of IGC re-annotated genomes recapitulates known relatedness, clustering by original annotation PAV simply distinguished which consortium did the annotation (and did not evolutionary relationships): PAV across the original annotations is largely artifactual.
jotlovell.bsky.social
To develop a baseline, we re-annotated the genomes with exactly the same 'Integrated Gene Caller' (IGC) pipeline. IGC annotations had ⬆️ BUSCO and ⬇️ false positives, yet more than halved PAV%. Critically, assembly-based relatedness predicted PAV similarity from IGC but not original annotations.
correlation between assembly and annotation similarity
jotlovell.bsky.social
We downloaded 'original' genome annotations directly from Soybase and Cottengen repos and calculated gene families from OrthoFinder. In both species there were WAY more PAVs than we expected: ~140k (86%) and ~90k (62%) of gene families were absent in ≥1 soybean and cotton genome respectively.
PAV tabulation in cotton and soybean
jotlovell.bsky.social
To study causes of gene PAV, we looked for species with (1) a history of polyploidy, (2) relatively low amounts of genetic variation, and (3) the availability of many high-quality reference genomes with independent RNA-seq evidenced gene annotation. Soybean and cotton popped to the top of the list.
jotlovell.bsky.social
We first looked at how divergence time correlates with gene PAV in pairs of plant and animal genomes that were annotated with the same method (mostly NCBI refseq).

While PAV generally scales with divergence time, it is 2-4X more common in plants, especially those with a history of polyploids.
table of n 1:1 orthologs and %PAV in plants and animals
jotlovell.bsky.social
Determining presence-absence variation (PAV) across reference genomes is a major goal of pangenome analysis. It turns out that A LOT of gene PAV is due to methodological artifacts.

We explore the causes of this in soybean and cotton datasets in our recent preprint: www.biorxiv.org/content/10.1...
pangenome 'expansion' curves for cotton and soybean
Reposted by John Lovell
carlbergstrom.com
Motherfucker wrote one sloppy paper in April 2020 and instead of being like oops, shit, my bad, he has kept doubling down until now he's killing most promising medical technology of the past quarter century rather than going to therapy.
jotlovell.bsky.social
Funding and support from: @energygov.bsky.social (especially The Office of Biological and Environmental Research), Bill and Melinda Gates Foundation, and many others. 🙏
jotlovell.bsky.social
This work is part of a global collaboration across many groups. In particular, Todd Mockler, who tragically passed in 2023, and the contributions of many scientists at @danforthcenter.bsky.social made much of this work possible. The pangenome was built by scientists at @jgi.doe.gov & HudsonAlpha.
jotlovell.bsky.social
Combined, these results illustrate the power of pangenomics for trait discovery ... but they also highlight how far we have to go. Integrated methods to probe and iteratively update variant calls in pangenome frameworks really are needed to bridge the gap between resources and stakeholders
jotlovell.bsky.social
There are three major haplotypes that each harbor several large structural variants but few coding variants. While the evidence for single-marker associations was limited, these three typable haplotypes segregate major variation in dhurrin concentration and drought severity of source habitat
The distribution of identity % for the four BGC pangenome groups across all northwestern sub-saharan Africa members of the diversity panel; colors follow  the phenotypic and climate distribution of the four clusters; annual precipitation is shown just for the region highlighted in panel E while dhurrin content is from all phenotyped members of the diversity pane
jotlovell.bsky.social
Finally, we combined pangenome-informed haplotype classification and tests of drought adaptation by probing the biosynthetic gene cluster that produces dhurrin, a secondary metabolite known to enhance drought stress tolerance and resistance against chewing insect herbivory ...
The 33 pangenome references were clustered into four BGC groups, and a ‘recombinant’ grey unclustered group for ‘IRAT204’, based on kmer similarity. The tubemap shows SVs ≥5kb with sequences shared across specific haplotypes (i.e, nodes in the pangenome graph) indicated by transparent rectangles