JPWeiland
@jpweiland.bsky.social
10K followers 72 following 510 posts
Scientist+Engineer. Infectious disease modeler. Posts and spelling mistakes my own
Posts Media Videos Starter Packs
Pinned
jpweiland.bsky.social
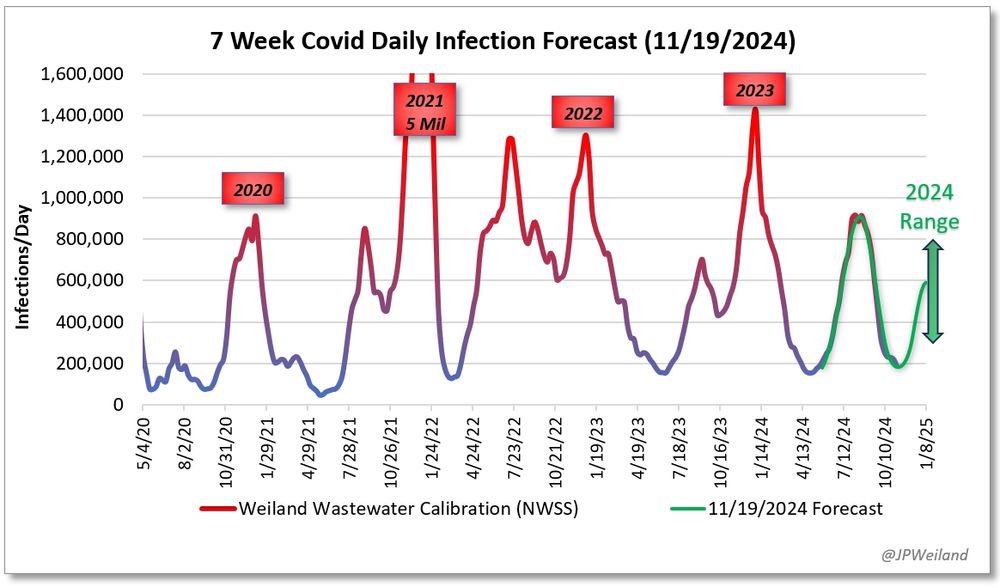
❄️ Holiday Season Forecast:

🔹The wildest forecast I've ever made was for Dec 2021, predicting multiple millions of daily infections. This one is easily second place. A very muted holiday wave relative to all prior years, due to weak evolution and large summer numbers.
jpweiland.bsky.social
Yes, different timelines in different places.
jpweiland.bsky.social
Not necessarily true. Evolution speed is a really large factor.. check out 2022, Tsunami winter, large summer and winter waves thereafter. This was during a period of rapid antibody evasion evolution
jpweiland.bsky.social
What you say is defined true. They're not going to be perfect apples to apples comparisons by default. But studies show that people get multiple Rhino infections per year (many more for highly exposed kids!), where covid is in the 1 in 18-24month range currently. Combining those with + rate is usfl
jpweiland.bsky.social
Hopefully we continue with the lack of meaningful evolution, which could lead to a more modest winter like last year. Ba.3.2 is probably the wild card.
jpweiland.bsky.social
Right now there is a surge in Rhinovirus, which typically causes congestion and coughing etc. The significant majority of those out and about with cold symptoms indeed have common colds. Dissimilar to July/Aug where more of it was C19.
jpweiland.bsky.social
Both emergency dept and wastewater data suggest a rapid decline in prevalence after a relatively modest summer peak. The lull in evolution continues... with no new fast variants close behind XFG.

That being said, we're still watching BA.3.2*
jpweiland.bsky.social
It's still cratering. One final warning that these constant nit picky nonsense responses will earn you a block.
jpweiland.bsky.social
The data I've seen over infectious period people are (on average) highly infectious for about 4 days, with a moderate level the day before and after, and a low level a few days after that (faint +). Those in the lower categories are much less likely to infect in short-medium contact lengths.
jpweiland.bsky.social
Thanks, it's the correct description.
jpweiland.bsky.social
Sept 28th update:

Wastewater daily inf estimate are cratering, just as anticipated via the model. This trend should continue for at least the next month.

🔸510,000 new infections/day
🔸1 in 66 currently infected
🔸1 in 165 highly infectious
jpweiland.bsky.social
Im in the process of revising my calibration that will raise the 2022 and beyond by about 11%
jpweiland.bsky.social
About 1.2 for 2022, 0.6 in 2023 and slightly under 0.6 in 2024.
jpweiland.bsky.social
I heard somewhere recently that if you want your child to excel in math and science, all you have to do is pop a bunch of Tylenol?

Big if true
jpweiland.bsky.social
Get ready for late October! Comet "Lemmon" is forecasted to reach an apparent magnitude of 5 to 2, which suggests it could be brighter than last year's comet!

And it's green! This is due to the presence of a molecule you'll never find on earth: C2 (diatomic carbon)
jpweiland.bsky.social
There are obviously going to be outliers on either side, and some situations with extended close contact out of the household (sharing a small office all day with another person, etc) where infection can reasonably happen.

Remember the avg infected person spreads to between 0.8-1.3 people.
jpweiland.bsky.social
I can clarify, typically these days the large bulk of the infected are highly contagious for ~4 days. There is an extended window of being less contagious where you may likely only infect a spouse or other house mate that you have extended close contact with (child, sleeping partner etc).
jpweiland.bsky.social
If you don't want to celebrate today, you can wait 100 years until the next
jpweiland.bsky.social
Happy Pythagoras day to all you nerds! (9/16/25)

3^2 + 4^2 = 5^2
jpweiland.bsky.social
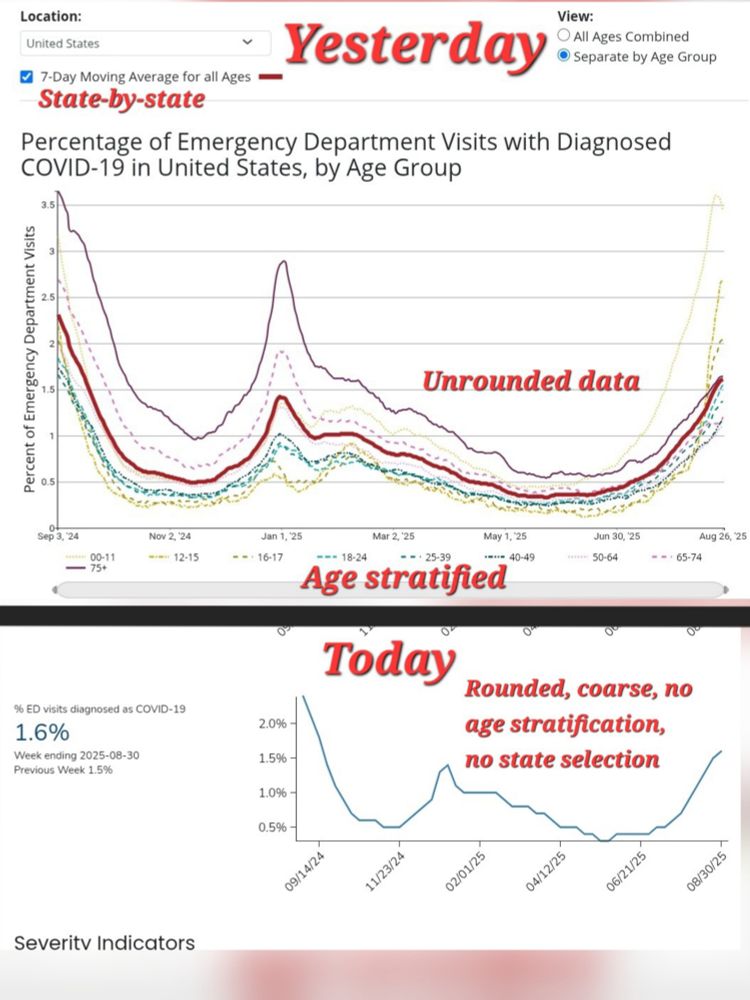
Here are the new and less precise public trends for positivity and %ED that both peaked around Sept 1. Both of this indicators typically slightly lead wastewater.
jpweiland.bsky.social
Sept 12th update:

Wastewater daily inf estimate increased to 600k this week. Positivity and ED data have both peaked and begun to retreat, and I expect wastewater will soon follow.

🔸600,000 new infections/day
🔸1 in 55 currently infected
🔸1 in 140 infectious out of household
jpweiland.bsky.social
Yep, it's all been damaged.
jpweiland.bsky.social
The CDC quietly neutered the best Covid data on the planet yesterday. ED data visualization has been stripped of age stratification, and state-by-state trends.

ED data has been far better for state by state trends than WW. Poof.
jpweiland.bsky.social
That's baked in to the model, the school aged kids have peaked already this past week.