Judith Bernett
@judith-bernett.bsky.social
99 followers 100 following 63 posts
Bioinformatics PhD student at TUM 🧬🖥️ 👩‍💻 Currently interested in machine learning pitfalls, drug response prediction, and protein-protein interaction prediction.
Posts Media Videos Starter Packs
judith-bernett.bsky.social
New pipeline version finally out now! 🥳
judith-bernett.bsky.social
🧵10/10 For that, we have launched the DrEval challenge!

Integrate your model into DrEval, significantly outperform our baselines (RF in LCO/LTO, GB in LDO), and we will send you a chocolate 🍫!
But be warned - if you do not outperform our naive predictors, you owe us one …
judith-bernett.bsky.social
🧵9/10 How can we move on? ✨
Scientific fields have seen dramatic leaps in progress through unified benchmarks like CASP for protein folding or ImageNet for vision. 📈
DrEval aims to be that living benchmark for drug response modeling, even without deep domain knowledge.
judith-bernett.bsky.social
🧵8/10 Further, models trained on CTRPv2 (largest dataset) generalize weakly to CTRPv1 and CCLE.
Our ablation study shows that multi-modal models ignore most of their input and focus on drug identities instead.
Pearson Correlation of model predictions vs. ground truth lnIC50 values for various models. All models are trained on CTRPv2 and tested on unseen cell lines (LCO) of CTRPv2, CTRPv1 and CCLE. The image shows a notable performance decrease when generalizing to other datasets. Mean ablation study results of the Multi-omics Random Forest and DIPK. One omics input is randomized at a time, such that a drug/cell line receives a random feature of another drug/cell line. Models are retrained from scratch with the randomized features. The R2 of the unperturbed models are subtracted from the R2 of the ablated models for each cross-validation fold: negative values indicate that the perturbation decreased model performance. Permutation mostly did not have any impact, the only visibly strong impact is the MolGNet drug features for DIPK and the drug fingerprints for the Multi Omics Random Forest.
judith-bernett.bsky.social
🧵7/10 Models learn limited biological signal beyond drug means. In LCO (relevant to personalized medicine), no model surpasses a Random Forest. Performance is strongly influenced by tissue identity. Models do not generalize to unseen drugs.
judith-bernett.bsky.social
🧵6/10 To address these challenges, we introduce DrEval, a living benchmark for bias-free, reproducible, and application-oriented drug response prediction! ✨
We offer a standalone Python package, drevalpy, and an accompanying nf-core pipeline, drugresponseeval, for scalability.
What did we find? 🕵️
Pipeline overview.
judith-bernett.bsky.social
🧵5/10
5. Missing ablation studies make it hard to identify the benefits of model parts (e.g., multi-omics).

6. Due to inconsistent preprocessing, metrics and resulting error scores are incomparable.
The drug response prediction field needs a robust, shared benchmark with uniformly processed data.
One data point corresponds to one drug-cell line combination. It can be seen that through the uniform preprocessing with CurveCurator, responses agree more with each other.
judith-bernett.bsky.social
🧵4/10
3. Pseudoreplication: Datasets appear big, but the measurements stem from a limited number of cell lines/drugs, leading to oversized, overfitted models.

4. Biased evaluation: Due to Simpson’s paradox, a model memorizing each drug’s mean (which is highly specific) seems to perform well.
Overview of commonly used response dataset. While they have many curves (e.g., 395025 for CTRPv2), the number of unique treatments and unique cell lines is smaller than 1000. Simpson’s paradox in drug response prediction. Predicted lnIC50 vs. ground truth lnIC50. The apparent correlation is largely driven by differences in mean drug potency. While the global R^2 is 0.71, the median R^2 per drug is 0.04, indicating limited learning of differential response beyond remembering mean cell line and drug
responses.
judith-bernett.bsky.social
🧵3/10 We see six key obstacles:
1. Reproducibility. Many models can't be run due to missing code, data, or documentation.

2. Data leakage. The split into training/validation/test has to reflect the real-world application. Otherwise, generalization fails, and performance metrics become inflated.
Depiction of different split variants into training, validation, and test set, and their application. Leave-Pairs-Out is just fitting for missing value imputation, leave-cell lines-out for personalized medicine, leave-tissue-out for drug repurposing, and leave-drugs-out for drug design.
judith-bernett.bsky.social
🧵2/10 In drug response prediction, we try to predict a summary metric of a dose-response curve (IC50/EC50/AUC), usually from unperturbed omics profiles of cancer cell lines. While model performance in the literature appears promising, no successful translation to the clinics has been reported. Why?
judith-bernett.bsky.social
🧬🖥️So excited to show you the outcome of @pascivers.bsky.social and my latest project: "From Hype to Health Check: Critical Evaluation of Drug Response Prediction Models with DrEval" doi.org/10.1101/2025.05.26.655288, published with M. Picciani, M. Wilhelm, K. Baum & @itisalist.bsky.social.
🧵1/10
Overview of the DrEval framework. Via input options, implemented state-of-the-art models can be compared against baselines of varying complexity. We address obstacles to progress in the field at each point in our pipeline: Our framework is available on PyPI and nf-core and we follow FAIReR standards for optimal reproducibility. DrEval is easily extendable as demonstrated here with a pseudocode implementation of a proteomics-based random forest. Custom viability data can be preprocessed with CurveCurator, leading to more consistent data and metrics. DrEval supports five widely used datasets with application-aware train/test splits that enable detecting weak generalization. Models are free to use provided or custom cell line– and drug features. The pipeline supports randomization-based ablation studies and performs robust hyperparameter tuning for all models. Evaluation is conducted using meaningful, bias-resistant metrics to avoid inflated results from artifacts such as Simpson’s paradox. All results are compiled into an interactive HTML report. Created in https://BioRender.com.
judith-bernett.bsky.social
@lisiarend.bsky.social, @quirinmanz.bsky.social, Kilian Kirmes, and I just created a nice overview of a typical CyTOF experiment using BioRender - now also available there as a template - and on Wikipedia! 🎨✨ Check it out and feel free to use it!
en.wikipedia.org/wiki/CyTOF
judith-bernett.bsky.social
15/15 🧵 What's the takeaway?
🚀ESM-2 embeddings boost performance considerably but surpassing 0.65 acc. might need other features
🧶Structural data was sparse; PDB does not have many pairwise PPIs ➡️ predict structure as intermediate step? Shift to complex prediction?
📈Advanced models need more data
judith-bernett.bsky.social

14/15 🧵 Of note, we found few suitable two-protein complexes in PDB. This highlights a limitation of current sequence-based PPI models, which focus on pairwise interactions while most complexes recorded involve homomers, cofactors, and additional ligands essential to the interaction.
judith-bernett.bsky.social
12/15 🧵 4 models internally form a layer len(p1)×len(p2), which we extracted for confident predictions and compared to PDB distance maps. Low correlations and notable disparity show that no model is capable of indirectly predicting distance maps or even detecting more complex structural features.
(a) Comparison of the real and predicted distance map of the D-SCRIPT-ESM-2 model for the 2A24 complex. White indicates low values (i.e., contact in the distance map), dark blue high values. (b) PDB complex of 2A24.
judith-bernett.bsky.social
11/15 🧵 Attention should be applied after reducing embedding size. When the encoder is inserted before, performance drops, possibly because of overfitting. Using too many input parameters for the attention mechanism might also obscure critical positions among the noise in the per-token embeddings.
Validation performance for inserting the encoder before or after dimensionality reduction via linear layers. Pre dimensionality reduction always results in a performance decrease.
judith-bernett.bsky.social
10/15 🧵Attention-based models profit from spectral normalization after linear layers. Removing it resulted in random predictions for all attention-based models. Without spectral normalization, the gradients in the attention mechanism might exponentially grow or decay, leading to nonsensical output.
Validation performance before and after removing spectral normalization after the linear layers for the models including an encoder and Richoux-ESM-2. Removing the spectral norm yields random results for all attention-based models.
judith-bernett.bsky.social
9/15 🧵 Adding self-/cross-attention to the 2d-baseline improved performance, but inserting encoders into other models had no effect. This may reflect the limit of the embeddings: models already nearing 0.65 gain little from attention, while simpler models not yet fully utilizing this info benefit.
Validation performances before and after adding a self/cross-attention encoder to the respective models. Only the 2d-baseline had increased performance (baseline < self-attention < cross-attention). TuNA profited marginally from cross-attention instead of self-attention.
judith-bernett.bsky.social
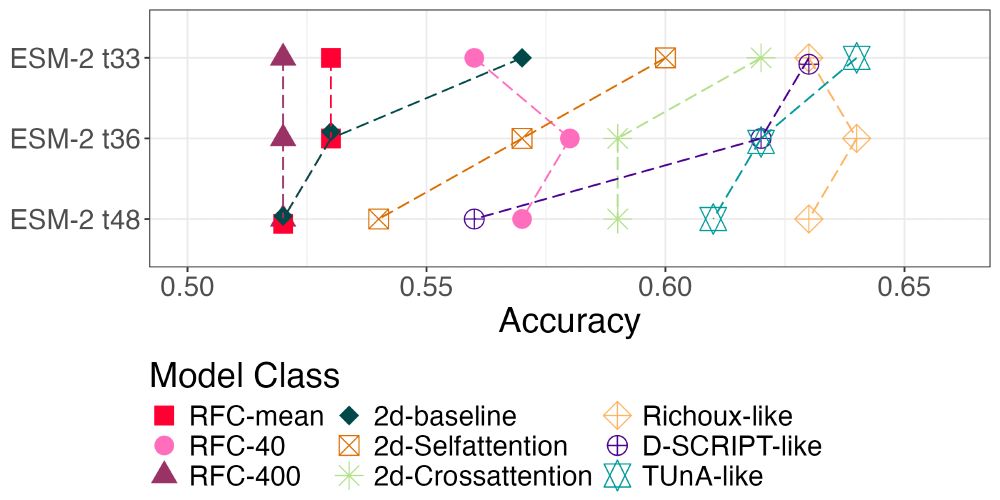
8/15 🧵 Models profit from smaller embeddings. Most of them performed best on the t33 (650M parameters) embeddings compared to the larger t36 (3B) and t48 (15B). The larger embeddings probably led to more overfitting due to the increase in model parameters (-> larger dataset needed).
Validation performances of the 9 tested models (random forest: mean embeddings, random forest: 40 & 400 PCA components of the embeddings, 2d-baseline, 2d-Selfattention, 2d-Crossattention, Richoux-like, D-SCRIPT-like, TUnA-like. Most models perform best with the smaller t33 embedding.
judith-bernett.bsky.social
7/15 🧵 ESM-2 embeddings boost all models to ~ 0.65 accuracy despite their architectural differences. The adapted Richoux and D-SCRIPT are lifted from near-random (prev. paper) to near-SOTA. This consistency suggests that the performance is primarily driven by the embeddings, not the models.
Table comparing all tested models with regards to accuracy, precision, recall, F1 score, binary cross entropy loss, training time, training time per epoch, and epoch of early stopping. Generally, TUnA – a per-token model – and the version of the Richoux model utilizing ESM-2 embeddings (a per-protein model) perform best.
judith-bernett.bsky.social
6/15 🧵 Per-token embeddings do not yield better results than averaged per-protein embeddings. While the embeddings substantially enhance performance, the type has minimal impact. This finding is unexpected, as per-token information should be critical for determining interaction.
Comparison of the architectures and the accuracies of the per-protein vs. per-token methods. Per-protein methods: Random Forest Classifier (0.577) and Richoux-like model (0.633). Per-token methods: 2d-baseline (0.575), Self/Crossattention (0.616 and 0.641; those are extensions of the 2d-baselines by insertion of a Transformer encoder), D-SCRIPT-like (0.628), and TUnA (0.645).
judith-bernett.bsky.social
5/15 🧵 We examine the impact of ESM-2 (per-token vs. averaged per-protein) embeddings of varying sizes, self-/cross-attention (vs. fully connected/convolutional layers), spectral normalization, and whether models can predict a distance map in the penultimate layer. These are our key findings:
Panels (e) and (f) of the overview figure, symbolizing the different tests and modifications.
judith-bernett.bsky.social
4/15 🧵 This raises a key question: Can unbiased sequence-based PPI models surpass this threshold, or has the field plateaued? If so, should we shift to models leveraging other inputs (e.g., structures)? This work systematically evaluates techniques from recent PPI models to answer this question.
judith-bernett.bsky.social
3/15 🧵 Since then, more models and approaches have emerged – to our delight – using our dataset. The biggest shift has been the adoption of pLM embeddings like ESM-2, with or without text-based enrichment, achieving accuracies around 0.65 with very different architectures and complexity levels.
judith-bernett.bsky.social
2/15 🧵Reminder: In our previous publication doi.org/10.1093/bib/... we found that common PPI prediction methods performed close to random on a data leakage-free dataset. The leakage resulted from sequence similarity and protein node degree shortcuts between the training and testing sets.
Cracking the black box of deep sequence-based protein–protein interaction prediction
Abstract. Identifying protein–protein interactions (PPIs) is crucial for deciphering biological pathways. Numerous prediction methods have been developed a
doi.org