Jeannie Wilkening
@jvwilkening.bsky.social
650 followers 420 following 82 posts
Ecohydrologist studying how water💧& plants 🌳 react to a changing climate | Lover of deserts 🌵 & desserts 🧁| Previously UC Berkeley, Cambridge, & U Arizona | she/her | Views my own
Posts Media Videos Starter Packs
jvwilkening.bsky.social
This is one of my favorite trees on campus!
jvwilkening.bsky.social
Despite how things ended, I still learned so much from my time at EPA about how applied, interdisciplinary science can drive progress on complex problems like climate change. I look forward to taking these experiences into my next chapter, with more details on that soon! 7/7
jvwilkening.bsky.social
As many of these people might be on the job market soon given the destruction of the EPA’s Office of Research and Development, I cannot emphasize enough how much of an asset they would be to any team. 6/7
jvwilkening.bsky.social
They are a truly special group of brilliant and dedicated scientists, and even with the growing challenges we faced in our work over the past few months it amazed me how they always continued to show up with care and kindness for each other and those that we served. 5/7
jvwilkening.bsky.social
Nevertheless, I’m so grateful to the incredible colleagues I got to work with in the Integrated Climate Sciences Division at EPA and am so proud of the things we were able to accomplish. 4/7
jvwilkening.bsky.social
On a broader level, I’m deeply concerned about the larger trend of dismantling scientific research at EPA, especially after having spent the last several months getting to see firsthand how this vital work supports safer, cleaner, and more resilient communities. 3/7
jvwilkening.bsky.social
On a personal level, I’m heartbroken. I had come to DC in the hopes that I could use my years of scientific training to serve the public. 2/7
jvwilkening.bsky.social
Recently, all the AAAS Science & Tech Policy Fellows at EPA were terminated from our positions with little notice and for no clear reason. This effectively ended a partnership that had been going since 1980 and which had brought hundreds of scientists to the EPA as fellows, many of whom stayed. 1/7
jvwilkening.bsky.social
Took your tip and checked out the Smithsonian Castle magnolias yesterday for my afternoon “desperately in need of some sunlight and fresh air” walk. Truly delightful!
Reposted by Jeannie Wilkening
msp-lter.bsky.social
@msp-lter.bsky.social, UMN St. Anthony Falls Lab (SAFL), and UMN College of Science & Engineering (CSE) researchers @jvwilkening.bsky.social and Xue Feng's new paper impresses the importance of keeping our urban #treecanopy healthy to promote urban #resilience and climate #adaptation
jvwilkening.bsky.social
Haven’t had a chance to pull together a thread on the paper, but so cool to see this highlight on some of my postdoc work! Urban trees can be a great tool for resiliency, but to be effective we also need to think about how the varied urban landscape leads to differences in how trees provide benefits
Reposted by Jeannie Wilkening
geoskinner.games
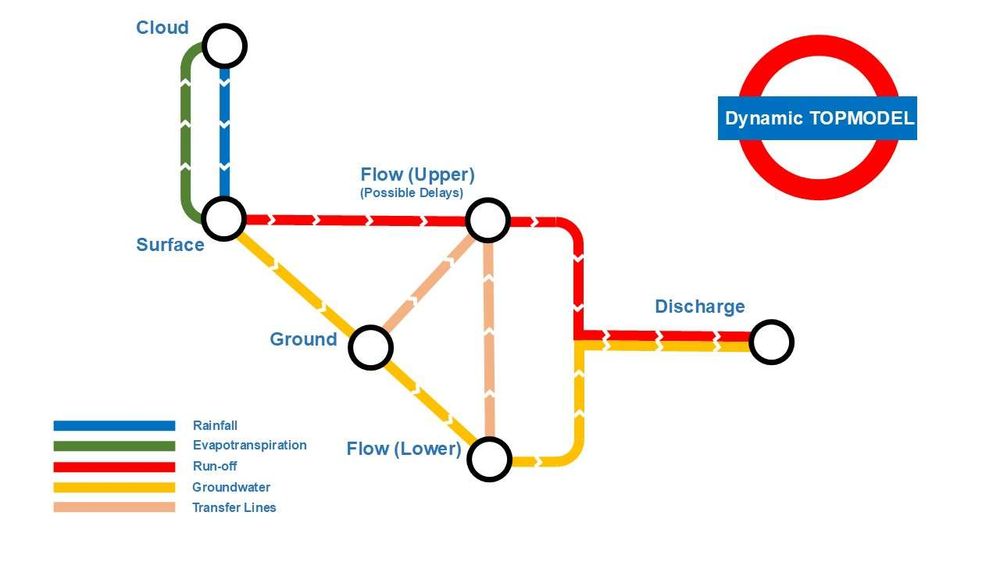
Conceptual hydrology models in the style of the Tube map?

Going through some old files from a few years ago and found this idea I was toying with. Not sure it is entirely accurate.
A conceptual model for the Dynamic-TOPMODEL hydrological model in the style of the London Underground Map. Flow transfers are shown as lines and stores as stations.
jvwilkening.bsky.social
Must also shout out everyone who made this possible, especially @drsallyet.bsky.social & Todd Dawson. This was a beast of a dissertation chapter that took up a lot of my mental, physical, and emotional energy in grad school. And we pulled it off even though a global pandemic got in the way 🫠
jvwilkening.bsky.social
TLDR: Collecting more simultaneous measurements of different parts of this high dimensional system during drought response and recovery is really valuable for identifying drivers and mechanisms, but there are also ways we can be strategic about it in terms of what measurements we take when.
jvwilkening.bsky.social
From that we saw a couple different things: 1) environmental variables are generally valuable as constraints & important things to measure, & 2) dynamics after (vs during) drought are generally harder to constrain, so targeting more intensive data collection after drought could be strategic
jvwilkening.bsky.social
Beyond just trying to understand what happened in this experiment, we also wanted to think about how we might better approach data collection during and after drought. To do this, we used metrics from information theory to characterize the “value” of msmnts as constraints fluxes and water status.
jvwilkening.bsky.social
Through piecing together different types of data that we collected, we hypothesize that this was likely due to a hormonal drought response, where effects can persist even after soil moisture is replenished via stomatal closure and changes in morphology (e.g., leaf area)
Figure showing photos of the trees over the course of the experiment. Following rewatering, there is a lot of leaf yellowing and drop.
jvwilkening.bsky.social
We saw that despite not pushing the trees to a point embolism, they showed a delayed & only partial recovery of water fluxes. We also saw a decoupling between sap flow and leaf water potentials after the trees were rewatered, and there was significant yellowing and leaf drop even after rewatering.
Figure showing six panels of sap flow data, one for each tree. As the drydown progressed, sap flow rates dropped. But even after rewatering, most trees still had much lower sap flow than they did at the beginning of the experiment.
jvwilkening.bsky.social
This is a bit of what this looked like behind the scenes for a couple weeks in Summer 2021. Safe to say I was a very tired PhD student.
jvwilkening.bsky.social
And I mean a LOT of measurements. In addition to installed sensors for sap flux and met, I tallied:
90 soil moisture, 196 leaf water potential, 540 isotope,
122 leaf area, 78 gas exchange, 21 root mass, 2 soil H2O retention curves, 6 vulnerability curves, 3 A/Ci curves & 5 light response curves
jvwilkening.bsky.social
In our experiment, we subjected trees to a drydown followed by a recovery period and were interested in exploring what we can do when we have a lot of data about these dynamics. So we took measurements to characterize water fluxes, water status, physiological traits, & environmental conditions.
Figure from the manuscript. The experimental setup consisted of six potted Populus trichocarpa trees on which various measurements were made to characterise plant function, environmental conditions and fluxes of water and carbon. Some of these measurements were continual (green), some were done only during select intensive sampling days (red) and others acted as background measurements that were completed before the start or following the conclusion of the experiment (blue). On Day 0, an 18O tracer was applied to the soil surface and a D tracer was injected halfway down the 
 65 cm soil column. Three intensive sampling days occurred on Days 2, 5 and 8, during the drydown period. The trees were then rewatered on Day 10 and a D tracer was applied to the surface. During the subsequent recovery period, two intensive sampling days occurred on Days 12 and 15. In this and the subsequent result figures, the drydown sampling days are represented with progressively darker shades of red, and the recovery sampling days are represented with progressively darker shades of blue.