Laura Gerrish
@lauragerrish.bsky.social
1.2K followers
170 following
30 posts
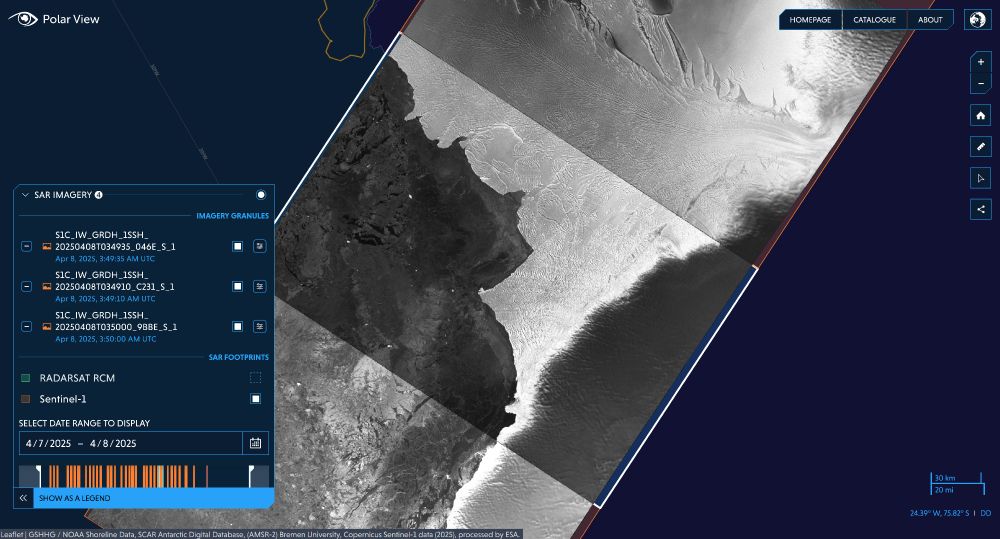
GIS and Mapping Specialist at the British Antarctic Survey. Interested in cartography, data visualisation, remote sensing and glaciology ❄️
Posts
Media
Videos
Starter Packs
Reposted by Laura Gerrish


Reposted by Laura Gerrish

Laura Gerrish
@lauragerrish.bsky.social
· Aug 27


Reposted by Laura Gerrish

Reposted by Laura Gerrish
Peter T Fretwell
@ptfretwell.bsky.social
· Jul 15


Reposted by Laura Gerrish

Reposted by Laura Gerrish
Reposted by Laura Gerrish

Reposted by Laura Gerrish

Reposted by Laura Gerrish

Reposted by Laura Gerrish
Roger Creel
@rogercreel.bsky.social
· Mar 23

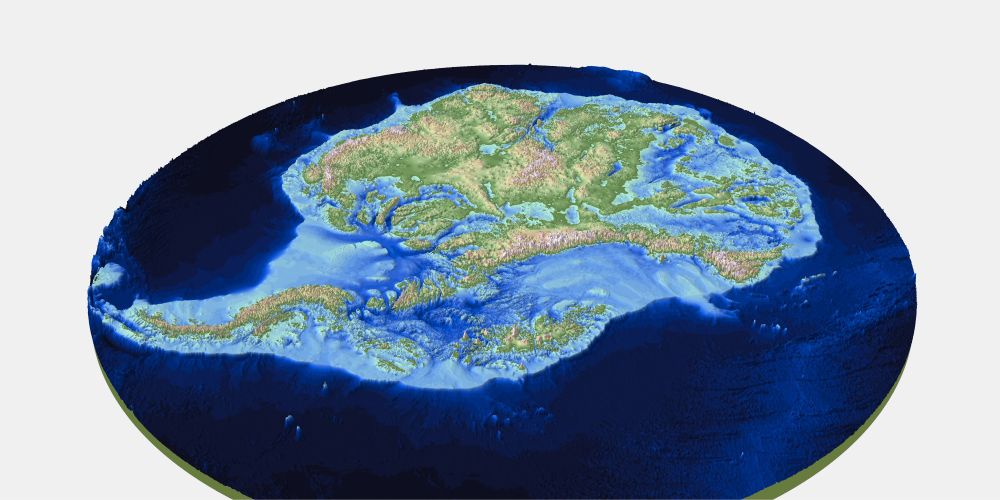
New coasts emerging from the retreat of Northern Hemisphere marine-terminating glaciers in the twenty-first century - Nature Climate Change
As marine-terminating glaciers retreat, they reveal new coastlines in many regions. Here the authors use satellite data to quantify these changes for the Northern Hemisphere, finding that between 2000...
www.nature.com

Reposted by Laura Gerrish
Reposted by Laura Gerrish


