Lukas Brunner
@lukasbrunner.bsky.social
730 followers
320 following
98 posts
Climate scientist @uni-hamburg.de: future projections, extremes, uncertainties | Formerly @ethz.ch @univie.ac.at | PhD @uni-graz.at | Python nerd | Hiking enthusiast
#SystemChangeNotClimateChange #OpenScience
More: https://lukasbrunner.github.io
Posts
Media
Videos
Starter Packs
Pinned


Reposted by Lukas Brunner
Reposted by Lukas Brunner


Reposted by Lukas Brunner
Reposted by Lukas Brunner

Lukas Brunner
@lukasbrunner.bsky.social
· Jun 17
Lukas Brunner
@lukasbrunner.bsky.social
· Jun 17

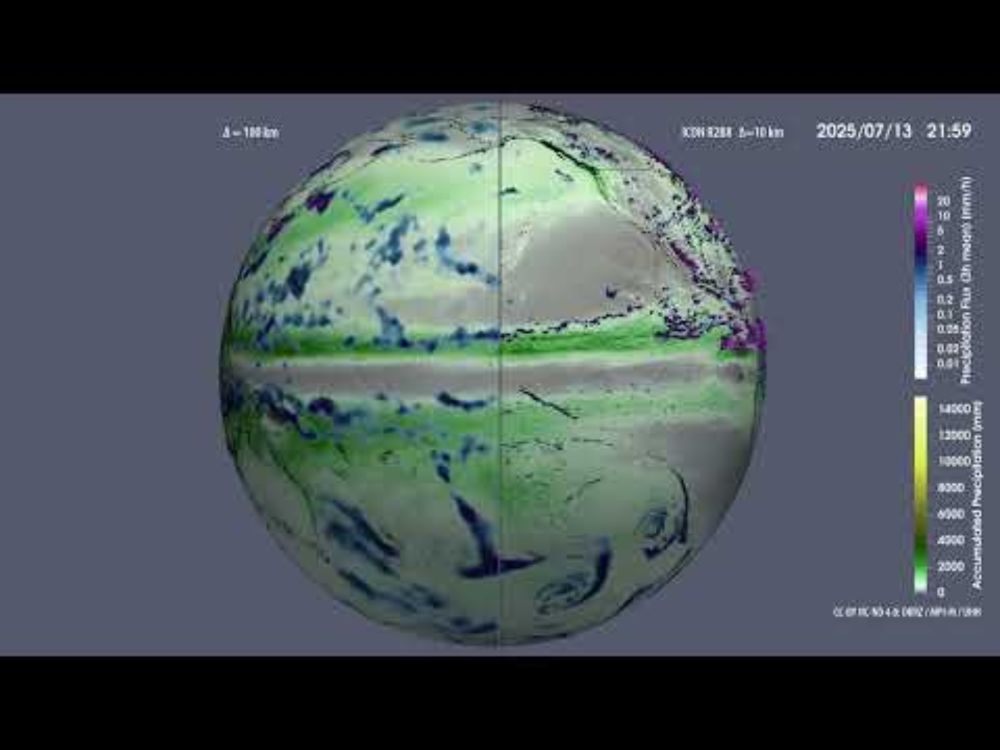
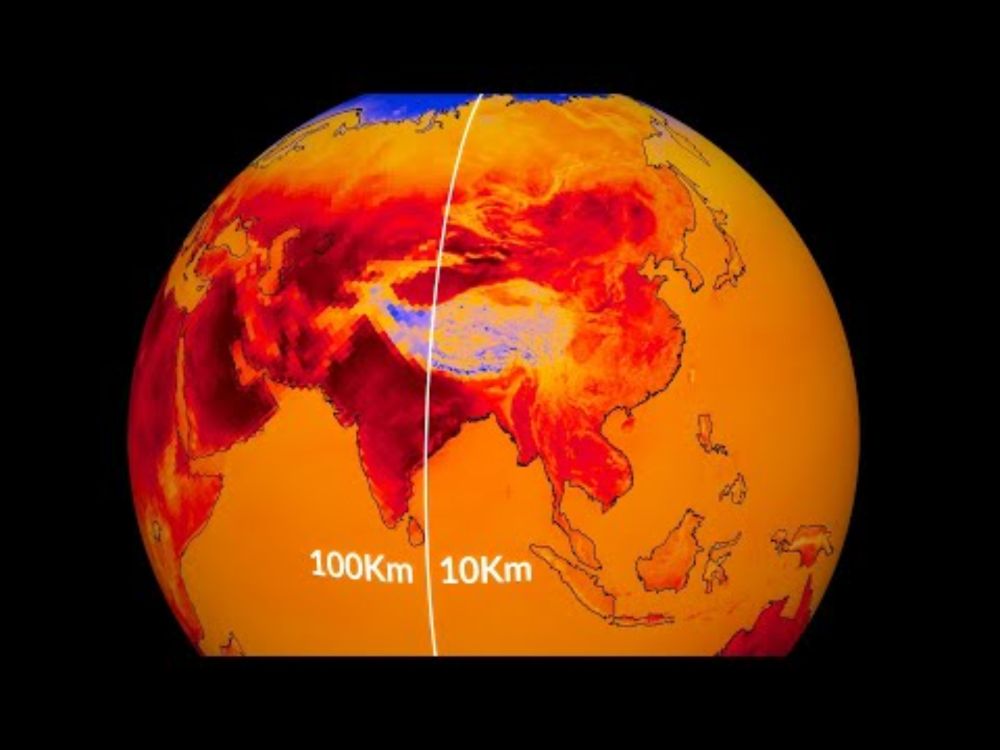
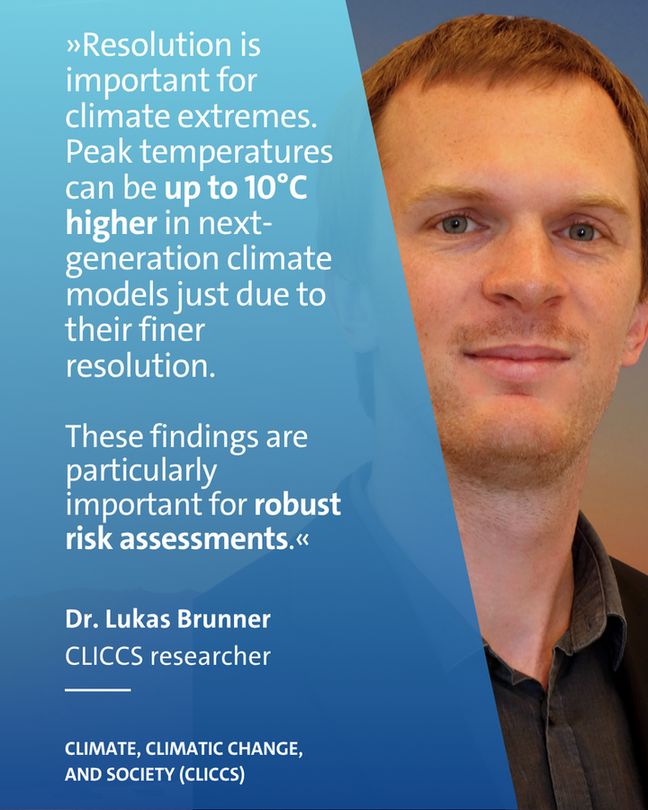
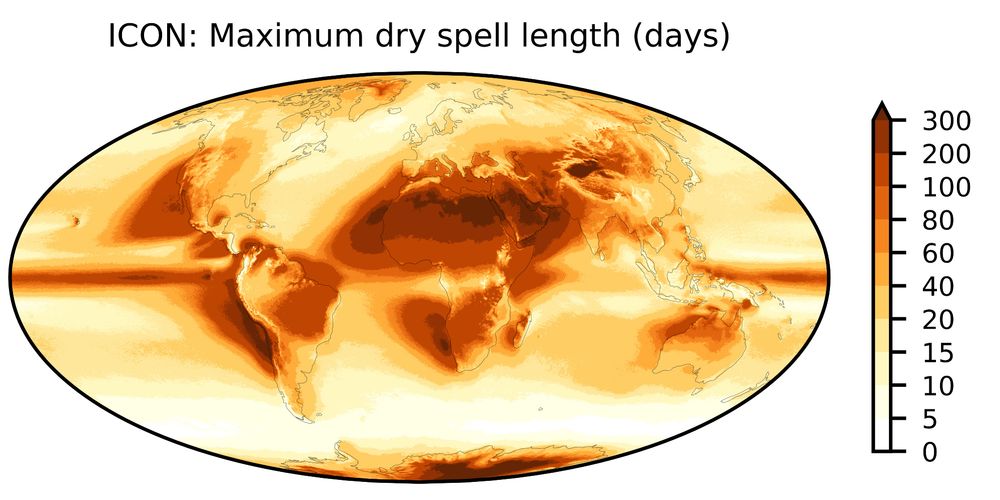
A global perspective on the spatial representation of climate extremes from km-scale models - IOPscience
A global perspective on the spatial representation of climate extremes from km-scale models, Brunner, Lukas, Poschlod, Benjamin, Dutra, Emanuel, Fischer, Erich M, Martius, Olivia, Sillmann, Jana
iopscience.iop.org
Reposted by Lukas Brunner