


Luke Neuendorf
@lukeneuendorf.bsky.social
Sports Analytics | Fantasy Football | Disc Golf
Portfolio: lukeneuendorf.com
Portfolio: lukeneuendorf.com
Pre-Snap Motion Usage Report after 2 weeks
The Jaguars and Jets have significantly increased their use of motion, while the Lions and Chiefs have shown a decline in motion usage.
The Jaguars and Jets have significantly increased their use of motion, while the Lions and Chiefs have shown a decline in motion usage.

September 18, 2025 at 4:54 AM
Pre-Snap Motion Usage Report after 2 weeks
The Jaguars and Jets have significantly increased their use of motion, while the Lions and Chiefs have shown a decline in motion usage.
The Jaguars and Jets have significantly increased their use of motion, while the Lions and Chiefs have shown a decline in motion usage.
NFL Week 1 Pre-Snap Motion Rates
Biggest Risers vs 2024:
📈 Jaguars: 34% → 60% (Liam Coen effect)
📈 Jets: 46% → 70% (Aaron Glenn effect)
Biggest Fallers vs 2024:
📉 Lions: 59% → 38%
The Consistent Extremes:
⬇️ Low: Broncos, Patriots
⬆️ High: 49ers, Rams
Biggest Risers vs 2024:
📈 Jaguars: 34% → 60% (Liam Coen effect)
📈 Jets: 46% → 70% (Aaron Glenn effect)
Biggest Fallers vs 2024:
📉 Lions: 59% → 38%
The Consistent Extremes:
⬇️ Low: Broncos, Patriots
⬆️ High: 49ers, Rams


September 11, 2025 at 6:54 AM
NFL Week 1 Pre-Snap Motion Rates
Biggest Risers vs 2024:
📈 Jaguars: 34% → 60% (Liam Coen effect)
📈 Jets: 46% → 70% (Aaron Glenn effect)
Biggest Fallers vs 2024:
📉 Lions: 59% → 38%
The Consistent Extremes:
⬇️ Low: Broncos, Patriots
⬆️ High: 49ers, Rams
Biggest Risers vs 2024:
📈 Jaguars: 34% → 60% (Liam Coen effect)
📈 Jets: 46% → 70% (Aaron Glenn effect)
Biggest Fallers vs 2024:
📉 Lions: 59% → 38%
The Consistent Extremes:
⬇️ Low: Broncos, Patriots
⬆️ High: 49ers, Rams
Week 1 YAC vs Expectation (via @NextGenStats):
DK Metcalf led all WRs, creating +10.6 more avg YAC than the model projected.
Second year player Malik Washington was a standout.
Stefon Diggs had the largest negative gap, underperforming his expected avg expected YAC by -10.3.
DK Metcalf led all WRs, creating +10.6 more avg YAC than the model projected.
Second year player Malik Washington was a standout.
Stefon Diggs had the largest negative gap, underperforming his expected avg expected YAC by -10.3.

September 10, 2025 at 4:06 AM
Week 1 YAC vs Expectation (via @NextGenStats):
DK Metcalf led all WRs, creating +10.6 more avg YAC than the model projected.
Second year player Malik Washington was a standout.
Stefon Diggs had the largest negative gap, underperforming his expected avg expected YAC by -10.3.
DK Metcalf led all WRs, creating +10.6 more avg YAC than the model projected.
Second year player Malik Washington was a standout.
Stefon Diggs had the largest negative gap, underperforming his expected avg expected YAC by -10.3.
Week 1 Rush Yards versus Expectation
Travis Etienne and Derrick Henry showed out
Travis Etienne and Derrick Henry showed out

September 10, 2025 at 3:50 AM
Week 1 Rush Yards versus Expectation
Travis Etienne and Derrick Henry showed out
Travis Etienne and Derrick Henry showed out
Who were the best field goal kickers in 2024?
Brandon Aubrey & Chris Boswell stood in a tier of their own.
Using a model that adjusts for distance, weather, pressure & stadium effects, I ranked kickers by Field Goal Points Above Replacement (FGPAR).
lukeneuendorf.substack.com/p/who-was-th...
Brandon Aubrey & Chris Boswell stood in a tier of their own.
Using a model that adjusts for distance, weather, pressure & stadium effects, I ranked kickers by Field Goal Points Above Replacement (FGPAR).
lukeneuendorf.substack.com/p/who-was-th...

September 2, 2025 at 1:03 AM
Who were the best field goal kickers in 2024?
Brandon Aubrey & Chris Boswell stood in a tier of their own.
Using a model that adjusts for distance, weather, pressure & stadium effects, I ranked kickers by Field Goal Points Above Replacement (FGPAR).
lukeneuendorf.substack.com/p/who-was-th...
Brandon Aubrey & Chris Boswell stood in a tier of their own.
Using a model that adjusts for distance, weather, pressure & stadium effects, I ranked kickers by Field Goal Points Above Replacement (FGPAR).
lukeneuendorf.substack.com/p/who-was-th...
Just published my first Substack: "Creating Space: A Quantitative Evaluation of Offensive Line Run Blocking" 🏈📊
Using NFL player tracking data, I developed a metric to measure individual linemen's contributions to run plays.
lukeneuendorf.substack.com/p/creating-s...
Using NFL player tracking data, I developed a metric to measure individual linemen's contributions to run plays.
lukeneuendorf.substack.com/p/creating-s...

Creating Space: A Quantitative Evaluation of Offensive Line Run Blocking
Public NFL player metrics have grown dramatically over the past decade.
lukeneuendorf.substack.com
August 23, 2025 at 4:15 PM
Just published my first Substack: "Creating Space: A Quantitative Evaluation of Offensive Line Run Blocking" 🏈📊
Using NFL player tracking data, I developed a metric to measure individual linemen's contributions to run plays.
lukeneuendorf.substack.com/p/creating-s...
Using NFL player tracking data, I developed a metric to measure individual linemen's contributions to run plays.
lukeneuendorf.substack.com/p/creating-s...
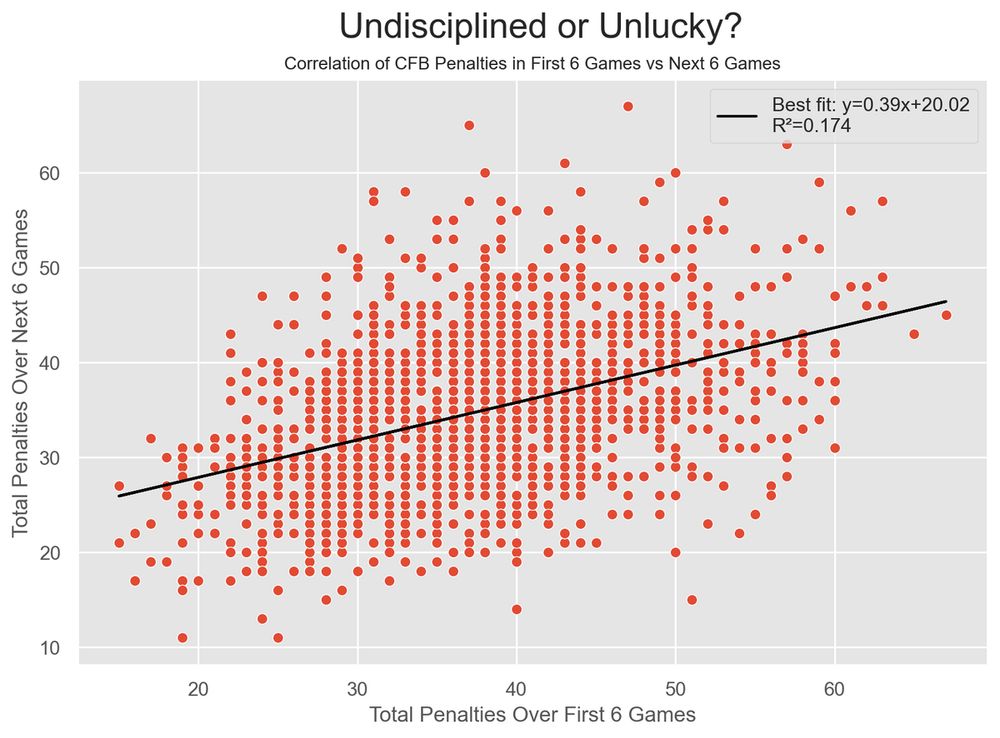
Do college football teams stay consistently disciplined?
Only 17% of the variation in penalty counts from the first 6 games predicts the next 6.
Penalties appear to be influenced more by context — game situations, officiating, and pressure — than by team identity alone.
Only 17% of the variation in penalty counts from the first 6 games predicts the next 6.
Penalties appear to be influenced more by context — game situations, officiating, and pressure — than by team identity alone.
June 22, 2025 at 4:15 PM
Do college football teams stay consistently disciplined?
Only 17% of the variation in penalty counts from the first 6 games predicts the next 6.
Penalties appear to be influenced more by context — game situations, officiating, and pressure — than by team identity alone.
Only 17% of the variation in penalty counts from the first 6 games predicts the next 6.
Penalties appear to be influenced more by context — game situations, officiating, and pressure — than by team identity alone.
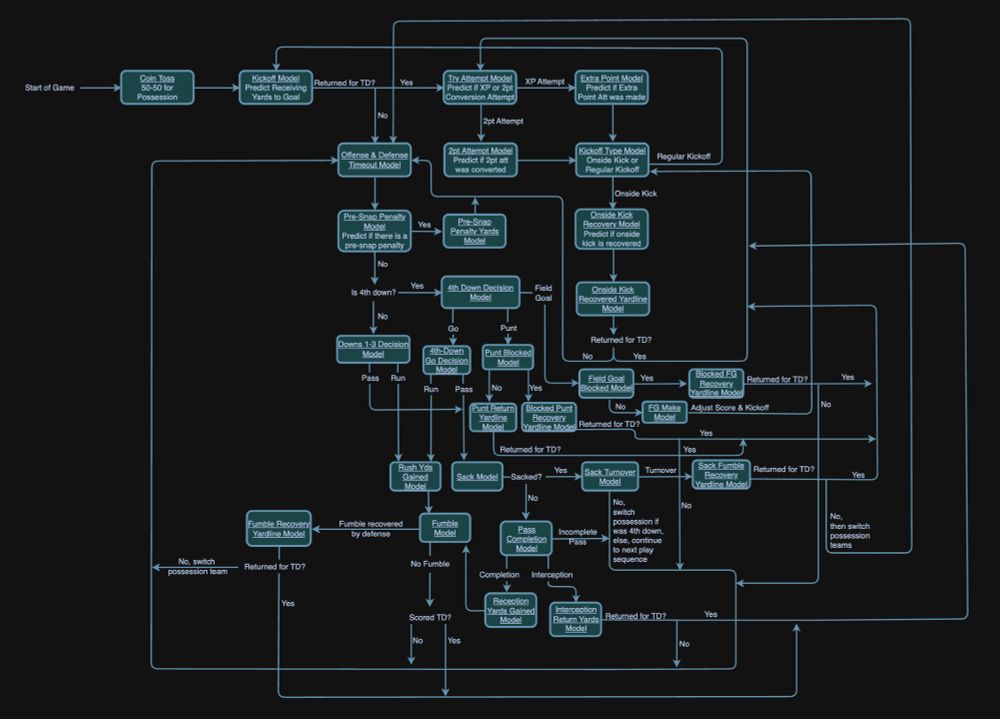
I recently build a 4th down decision model for college football. However, the win probability model is failing to capture late game decision making logic.
I've started working on a Monte Carlo simulation model of CFB games and it is turning into a rats nest quickly 😅
I've started working on a Monte Carlo simulation model of CFB games and it is turning into a rats nest quickly 😅
June 15, 2025 at 9:12 PM
I recently build a 4th down decision model for college football. However, the win probability model is failing to capture late game decision making logic.
I've started working on a Monte Carlo simulation model of CFB games and it is turning into a rats nest quickly 😅
I've started working on a Monte Carlo simulation model of CFB games and it is turning into a rats nest quickly 😅
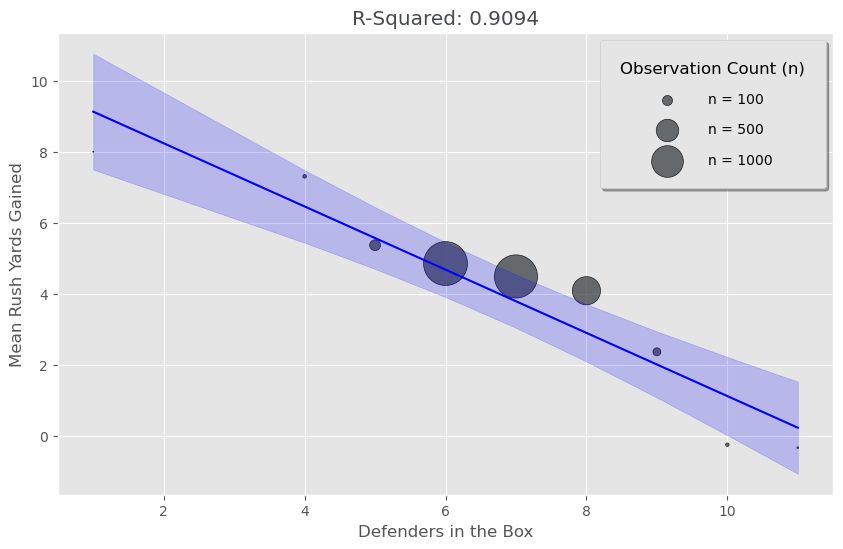
It's an obvious conclusion that adding more defenders to the box will stop the run, but i never thought the relationship would be this clear.
This is a regression between the number of defenders in the box and the aggregated mean of rush yards gained for each number of defenders in the box.
This is a regression between the number of defenders in the box and the aggregated mean of rush yards gained for each number of defenders in the box.
January 2, 2025 at 6:17 PM
It's an obvious conclusion that adding more defenders to the box will stop the run, but i never thought the relationship would be this clear.
This is a regression between the number of defenders in the box and the aggregated mean of rush yards gained for each number of defenders in the box.
This is a regression between the number of defenders in the box and the aggregated mean of rush yards gained for each number of defenders in the box.