Maarten Lambrechts
@maartenzam.bsky.social
3.6K followers 550 following 240 posts
Data visualization consultant at the Development Data Group of the World Bank www.maartenlambrechts.com
Posts Media Videos Starter Packs
maartenzam.bsky.social
These must be some of the most morally bankrupt graphics ever made
jacksapoch.bsky.social
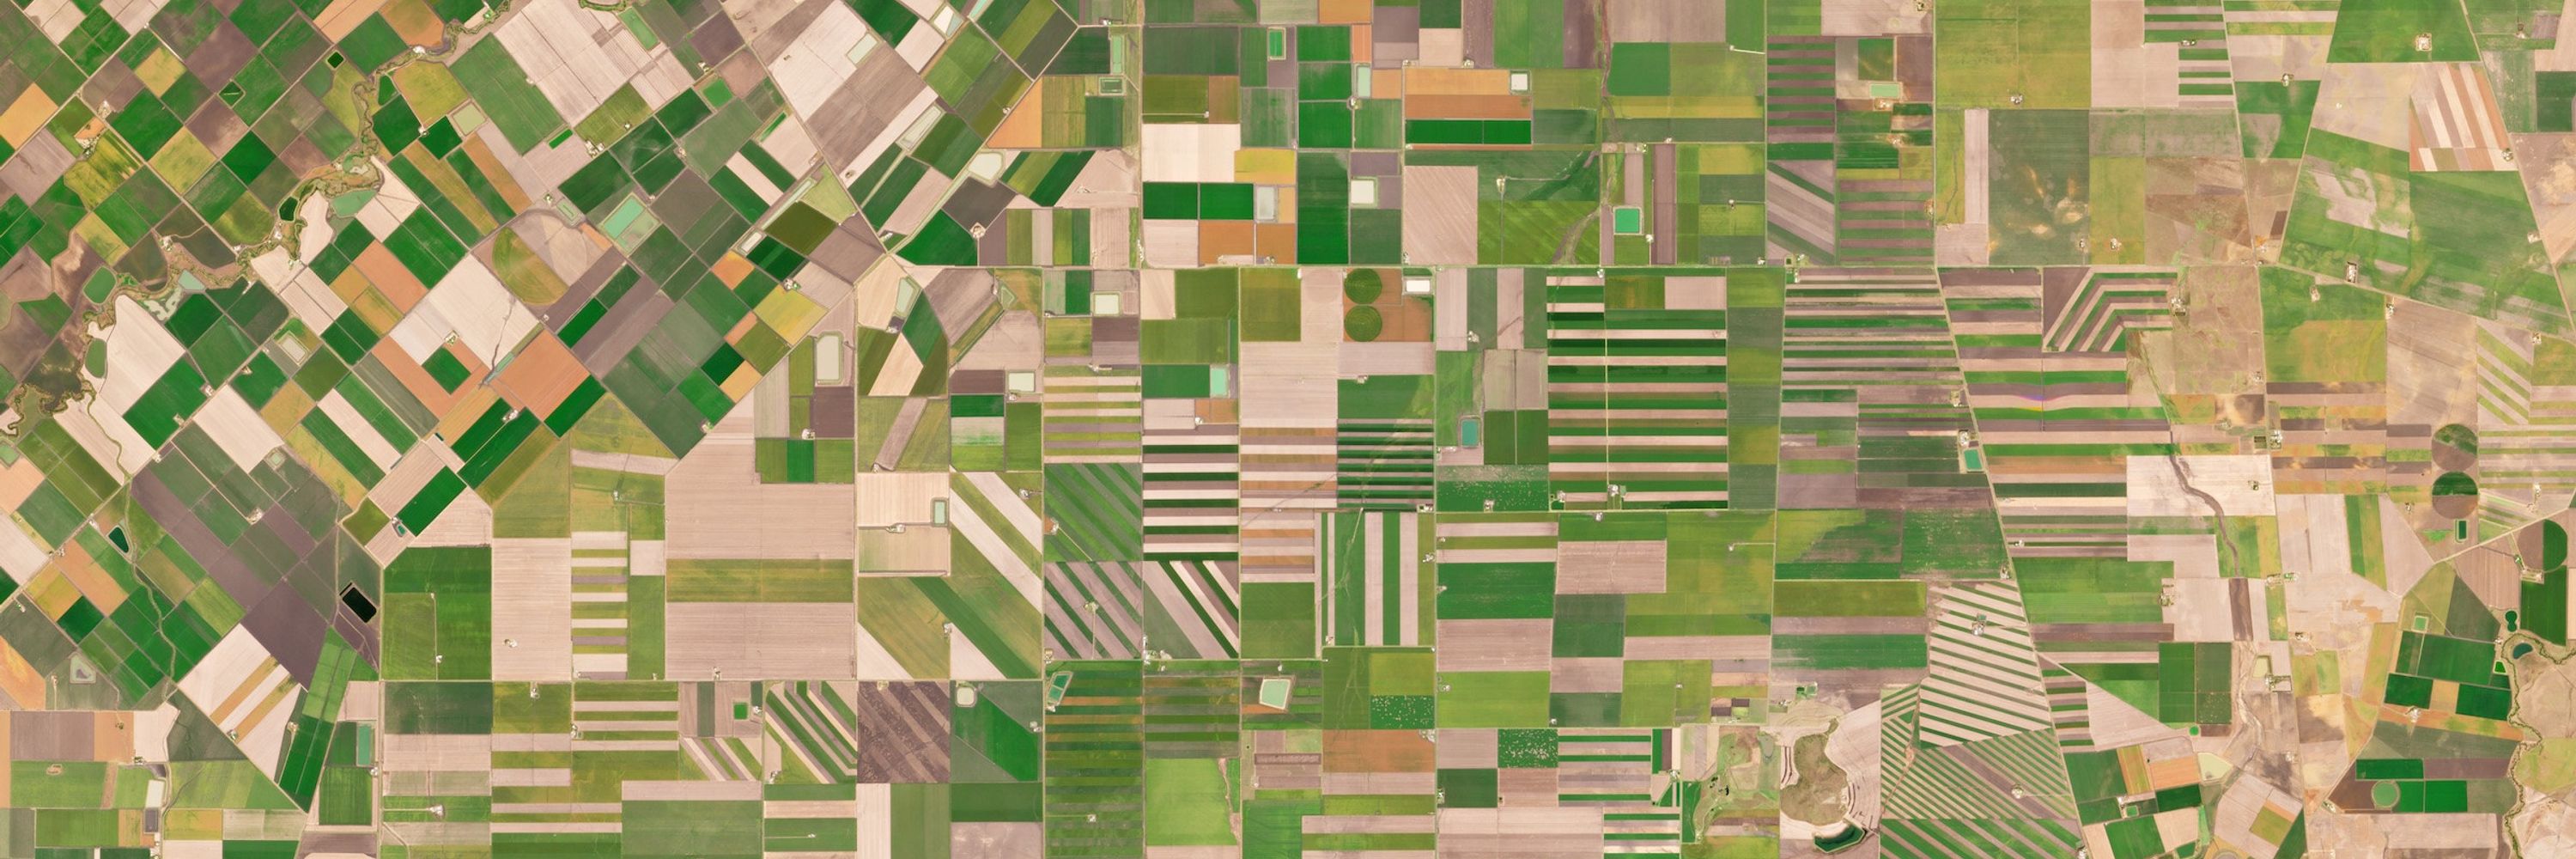
NEW: Since October 2023, the IDF Spokesperson's Unit has released dozens of 3D animations illustrating alleged Hamas, Hezbollah, and Iranian sites

The style is now unmistakable: satellite zoom-ins, black & white wireframes, and red-textured houses - a new visual language of war
Reposted by Maarten Lambrechts
watershedlab.bsky.social
The war in Gaza has been going on for two years. It must end.
Reposted by Maarten Lambrechts
bellingcat.com
Our researchers have noticed today that NASA FIRMS, one of the main free and available open source sites for monitoring fires around the world has a new notice on it stating that NASA is no longer updating the site due to a lack in federal funding. firms.modaps.eosdis.nasa.gov/map/
Reposted by Maarten Lambrechts
hydrology.nl
The amazingly astonishing Assiniboine River, Manitoba, Canada, again.
Reposted by Maarten Lambrechts
karimdouieb.bsky.social
So here it is: my dumb data viz experiment. 🍩

✔️ Solves the continuity problem
❌ Harder to spot patterns
❌ Hours are visually distorted

But hey… not everything has to be practical, sometimes it’s just fun! 😅 Also: how cool would it be to create a physical object like this?
maartenzam.bsky.social
Sentinel Hub works like that, which was acquired by Planet, where Rob and I were colleagues. It seems like a nice paradigm, bit interfaces are clunky and very limiting
maartenzam.bsky.social
Ik know where *that*'s coming from ;)
Reposted by Maarten Lambrechts
mamassian.bsky.social
A nice shift in perceived colour between central and peripheral vision. The fixated disc looks purple while the others look blue.

The effect presumably comes from the absence of S-cones in the fovea.

From Hinnerk Schulz-Hildebrandt:
arxiv.org/pdf/2509.115...
An array of 9 purple discs on a blue background. Figure from Hinnerk Schulz-Hildebrandt.
Reposted by Maarten Lambrechts
aatishb.bsky.social
Happy September Equinox! Today the dividing line between day and night runs exactly from the North pole to the South pole, and the sun is directly over the equator. This is an actual image of the Earth today, taken from the Himawari-8 satellite.
A photograph of the Earth taken from Himawari-8, showing the earth perfectly divided into day on the left and night on the right, with the day/night divider running from the north pole to the south pole. A photograph of the Earth taken from Himawari-8, showing the earth perfectly divided into day on the left and night on the right, with the day/night divider running from the north pole to the south pole. A thin circle and dotted line are overlaid to show the division of the full circle into two semicircles.
Reposted by Maarten Lambrechts
avischarf.bsky.social
Fresh Planet Labs imagery (15Sep v 1Sep) shows already displaced Gazans leaving for the south. Most tents gone - as expected - first from north (Naser) and south (Tel El Hawa) n'hoods.
Reposted by Maarten Lambrechts
pfsmet.bsky.social
I naively thought: let's roughly extrapolate the height at which Mondo Duplantis's pole vault world record series would end. The second derivative turns out to be positive! 😱
#math in the wild #tokyo2025 #worldathletics
Graph based on the data in https://en.wikipedia.org/wiki/Men%27s_pole_vault_world_record_progression , showing the world record height evolution from 1965 (about 5.3m) to 2025 (6.30m). The world records by Sergey Bubka are indicated in blue. In the first part of his career, there was a rapid succession of world records and then it leveled off (second derivative of the curve is negative). After about 20 years without world records (flat line in the curve, first derivative ~0), Armand Duplantis started breaking world records, cm by cm (indicated in orange). The second derivative is positive, which means the curve bends upwards.
Reposted by Maarten Lambrechts
copernicusecmwf.bsky.social
This year, the ozone hole presented an early development, reaching a larger-than-average area mid-September. On #WorldOzoneDay, #CopernicusAtmosphere continues to provide tools for everyone to monitor the health of our planet.
Reposted by Maarten Lambrechts
avischarf.bsky.social
Gazans displaced from the city due Israeli op have set up tents in Deir al Balah, and near Khan Yunis' Hamad Town.
Almost none have yet made it to the south near Rafah, where Israel is setting up two new GHF centers
Planet Labs 14Sep/05Sep
Reposted by Maarten Lambrechts
thomasp85.com
I am beyond excited to announce that ggplot2 4.0.0 has just landed on CRAN.

It's not every day we have a new major #ggplot2 release but it is a fitting 18 year birthday present for the package.

Get an overview of the release in this blog post and be on the lookout for more in-depth posts #rstats
ggplot2 4.0.0
A new major version of ggplot2 has been released on CRAN. Find out what is new here.
www.tidyverse.org
Reposted by Maarten Lambrechts
erwanrivault.com
Launch day 🚀

We’ve just released @chartlecc.bsky.social - a daily chart game!

Your job is to guess which country is represented by the red line in today's chart. You get 5 tries, no other clues!

Play today, come back tomorrow for a different chart with new data and share with your chart friends 📈
Chartle - A daily chart game
Guess the country in red by analysing today's chart
chartle.cc
Reposted by Maarten Lambrechts
rsimmon.bsky.social
Interesting workflow includes GQIS, Mapshaper, & Illustrator. Data from OSM & analysis of Sentinel-2 imagery. Cameo from hi-res Planet Labs data.
datawrapper.de
This week, our co-founder Gregor helps us make sense, or at least get a clearer picture, of the scale of destruction in the streets of Gaza. 🗺️

www.datawrapper.de/blog/mapping...
Mapping destruction in Gaza | Datawrapper Blog
Understanding Gaza’s urban damage through satellite data and mapping.
www.datawrapper.de
Reposted by Maarten Lambrechts
mikegalsworthy.bsky.social
Aaaand they’ve just covered it up.

Which is just another layer of irony…

…given that this is state action against protest about state action against protest.
maartenzam.bsky.social
I was in Florence when that picture was taken :)
Reposted by Maarten Lambrechts
brockmannconsult.bsky.social
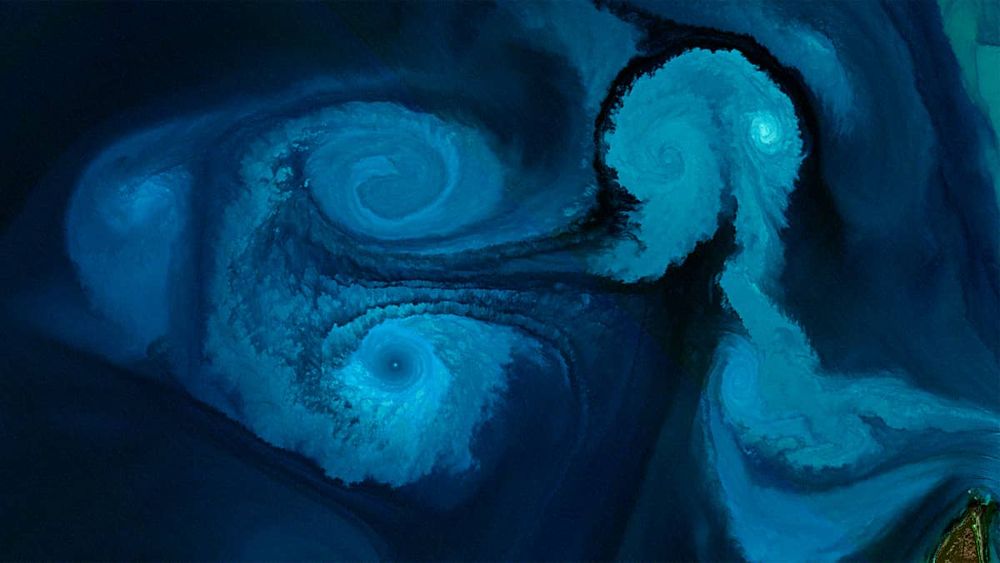
Nature’s own beauty generator: tides, winds and coastal shapes combine off Argentina’s Valdés Peninsula, creating breathtaking swirls captured by Sentinel-2. 🌀🌊
#EarthObservation #Sentinel2 #EarthArt #PlanetBeauty

Find out more on our new #BCEarthGallery blog!
👉 bit.ly/4mJjVRP