


Mac
@machumbie.bsky.social
Option trader/ Car lover & Dealer/ Entrepreneur/ Owner of small and medium sized businesses.
I blew up accounts
I lost hundreds of thousands
But I cracked the code and made my first Million
If you’re starting with a small account, this is the exact blueprint I wish I had on Day 1
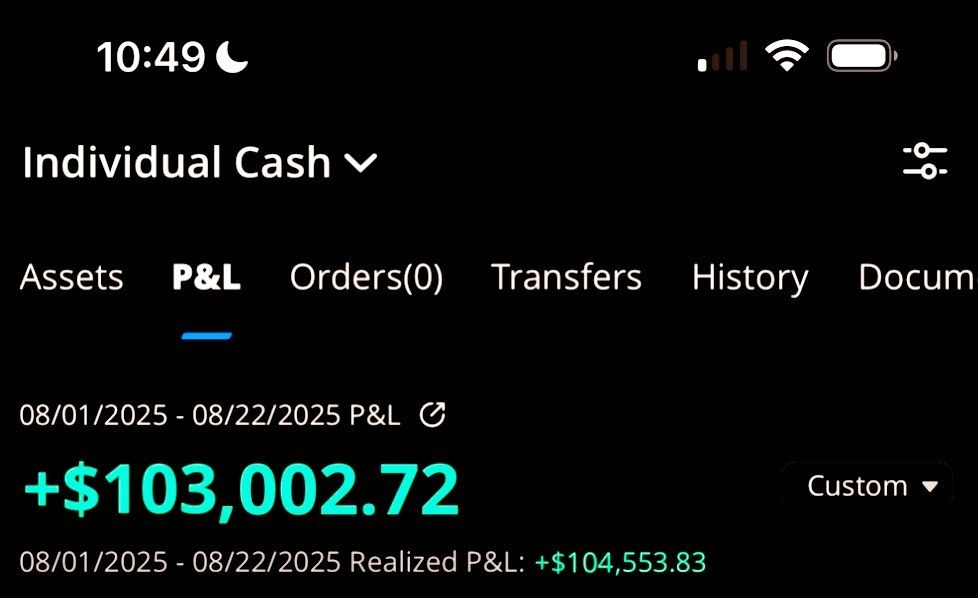
It gave me my first $100K year trading
Steal it in 2 minutes & RT to help traders
I lost hundreds of thousands
But I cracked the code and made my first Million
If you’re starting with a small account, this is the exact blueprint I wish I had on Day 1
It gave me my first $100K year trading
Steal it in 2 minutes & RT to help traders
August 25, 2025 at 8:55 PM
I blew up accounts
I lost hundreds of thousands
But I cracked the code and made my first Million
If you’re starting with a small account, this is the exact blueprint I wish I had on Day 1
It gave me my first $100K year trading
Steal it in 2 minutes & RT to help traders
I lost hundreds of thousands
But I cracked the code and made my first Million
If you’re starting with a small account, this is the exact blueprint I wish I had on Day 1
It gave me my first $100K year trading
Steal it in 2 minutes & RT to help traders
⚠️ The US debt crisis is becoming more visible in the markets:
The gap between two-year and 30-year Treasury yields is near its widest since early 2022.
At the same time, the US Dollar index is near its lowest in over 3 years.
Investors appear to be dumping US assets.
The gap between two-year and 30-year Treasury yields is near its widest since early 2022.
At the same time, the US Dollar index is near its lowest in over 3 years.
Investors appear to be dumping US assets.

August 23, 2025 at 2:09 PM
⚠️ The US debt crisis is becoming more visible in the markets:
The gap between two-year and 30-year Treasury yields is near its widest since early 2022.
At the same time, the US Dollar index is near its lowest in over 3 years.
Investors appear to be dumping US assets.
The gap between two-year and 30-year Treasury yields is near its widest since early 2022.
At the same time, the US Dollar index is near its lowest in over 3 years.
Investors appear to be dumping US assets.
🚨This is INSANE:
The BLS is set to revise DOWN US job numbers by 550,000-950,000 for 12 months ending March 2025 on September 9, according to Goldman Sachs estimates.
That’d be the biggest 12-month downward revision in 15 YEARS.
Total cut over 2 years would reach 1.5M jobs.
The BLS is set to revise DOWN US job numbers by 550,000-950,000 for 12 months ending March 2025 on September 9, according to Goldman Sachs estimates.
That’d be the biggest 12-month downward revision in 15 YEARS.
Total cut over 2 years would reach 1.5M jobs.

August 19, 2025 at 9:32 PM
🚨This is INSANE:
The BLS is set to revise DOWN US job numbers by 550,000-950,000 for 12 months ending March 2025 on September 9, according to Goldman Sachs estimates.
That’d be the biggest 12-month downward revision in 15 YEARS.
Total cut over 2 years would reach 1.5M jobs.
The BLS is set to revise DOWN US job numbers by 550,000-950,000 for 12 months ending March 2025 on September 9, according to Goldman Sachs estimates.
That’d be the biggest 12-month downward revision in 15 YEARS.
Total cut over 2 years would reach 1.5M jobs.
⚠️A record net 91% of FMS investors in the August BofA survey said US equities are OVERVALUED.
At the same time, 49% said Emerging Markets are undervalued
Almost every professional investor on this planet believes the US stock market is OVERVALUED.
At the same time, 49% said Emerging Markets are undervalued
Almost every professional investor on this planet believes the US stock market is OVERVALUED.
August 18, 2025 at 11:59 PM
⚠️A record net 91% of FMS investors in the August BofA survey said US equities are OVERVALUED.
At the same time, 49% said Emerging Markets are undervalued
Almost every professional investor on this planet believes the US stock market is OVERVALUED.
At the same time, 49% said Emerging Markets are undervalued
Almost every professional investor on this planet believes the US stock market is OVERVALUED.
🚨US stock market valuations have reached CRAZY levels:
The geometric average of 4 long-term valuation metrics for the S&P 500 has hit 163%, an ALL-TIME HIGH.
This is more than 3 standard deviations ABOVE the mean.
By comparison, the 2000 Dot-Com Bubble peaked at just 126%.
The geometric average of 4 long-term valuation metrics for the S&P 500 has hit 163%, an ALL-TIME HIGH.
This is more than 3 standard deviations ABOVE the mean.
By comparison, the 2000 Dot-Com Bubble peaked at just 126%.

August 18, 2025 at 7:33 PM
🚨US stock market valuations have reached CRAZY levels:
The geometric average of 4 long-term valuation metrics for the S&P 500 has hit 163%, an ALL-TIME HIGH.
This is more than 3 standard deviations ABOVE the mean.
By comparison, the 2000 Dot-Com Bubble peaked at just 126%.
The geometric average of 4 long-term valuation metrics for the S&P 500 has hit 163%, an ALL-TIME HIGH.
This is more than 3 standard deviations ABOVE the mean.
By comparison, the 2000 Dot-Com Bubble peaked at just 126%.
⚠️Investors are getting more cautious about leverage:
US long leveraged ETFs have seen $5.9 BILLION in net OUTFLOWS over the last 2 weeks, the most in at least 20 months.
These funds have seen outflows in 16 out of the last 18 weeks.
Time for a market pullback?
US long leveraged ETFs have seen $5.9 BILLION in net OUTFLOWS over the last 2 weeks, the most in at least 20 months.
These funds have seen outflows in 16 out of the last 18 weeks.
Time for a market pullback?

August 18, 2025 at 7:30 PM
⚠️Investors are getting more cautious about leverage:
US long leveraged ETFs have seen $5.9 BILLION in net OUTFLOWS over the last 2 weeks, the most in at least 20 months.
These funds have seen outflows in 16 out of the last 18 weeks.
Time for a market pullback?
US long leveraged ETFs have seen $5.9 BILLION in net OUTFLOWS over the last 2 weeks, the most in at least 20 months.
These funds have seen outflows in 16 out of the last 18 weeks.
Time for a market pullback?
🚨This is INSANE:
The BLS collects ~90,000 price quotes each month across 200 categories to calculate CPI.
Normally, about 10% of prices are estimated when data is missing.
Now ~32% are MADE UP, based on assumptions, not real prices, double the share seen in the 2020 Crisis.
The BLS collects ~90,000 price quotes each month across 200 categories to calculate CPI.
Normally, about 10% of prices are estimated when data is missing.
Now ~32% are MADE UP, based on assumptions, not real prices, double the share seen in the 2020 Crisis.

August 17, 2025 at 11:22 PM
🚨This is INSANE:
The BLS collects ~90,000 price quotes each month across 200 categories to calculate CPI.
Normally, about 10% of prices are estimated when data is missing.
Now ~32% are MADE UP, based on assumptions, not real prices, double the share seen in the 2020 Crisis.
The BLS collects ~90,000 price quotes each month across 200 categories to calculate CPI.
Normally, about 10% of prices are estimated when data is missing.
Now ~32% are MADE UP, based on assumptions, not real prices, double the share seen in the 2020 Crisis.
⚠️The US corporate bond market is sending a WARNING:
The extra yield that investors receive for owning investment-grade corporate bonds instead of Treasuries FELL to
just 73 basis points, the lowest since 1998, according to Bloomberg.
MARKETS ARE HISTORICALLY EXPENSIVE
The extra yield that investors receive for owning investment-grade corporate bonds instead of Treasuries FELL to
just 73 basis points, the lowest since 1998, according to Bloomberg.
MARKETS ARE HISTORICALLY EXPENSIVE

August 17, 2025 at 5:48 PM
⚠️The US corporate bond market is sending a WARNING:
The extra yield that investors receive for owning investment-grade corporate bonds instead of Treasuries FELL to
just 73 basis points, the lowest since 1998, according to Bloomberg.
MARKETS ARE HISTORICALLY EXPENSIVE
The extra yield that investors receive for owning investment-grade corporate bonds instead of Treasuries FELL to
just 73 basis points, the lowest since 1998, according to Bloomberg.
MARKETS ARE HISTORICALLY EXPENSIVE
Important demand shift underway in US housing:
Renter households are surging as homeowner growth stalls.
This shift (and whether or not it continues) matters for any company tied to US housing....
Renter households are surging as homeowner growth stalls.
This shift (and whether or not it continues) matters for any company tied to US housing....

August 17, 2025 at 12:15 AM
Important demand shift underway in US housing:
Renter households are surging as homeowner growth stalls.
This shift (and whether or not it continues) matters for any company tied to US housing....
Renter households are surging as homeowner growth stalls.
This shift (and whether or not it continues) matters for any company tied to US housing....
Article 👉 - www.wsj.com/economy/amer...
August 17, 2025 at 12:13 AM
Article 👉 - www.wsj.com/economy/amer...
"People are moving to new homes and new cities at around the lowest rate on record."
Our internal data shows households moving between metro areas spiked in 2021 and has fallen by 29% since.
Our internal data shows households moving between metro areas spiked in 2021 and has fallen by 29% since.

August 17, 2025 at 12:06 AM
"People are moving to new homes and new cities at around the lowest rate on record."
Our internal data shows households moving between metro areas spiked in 2021 and has fallen by 29% since.
Our internal data shows households moving between metro areas spiked in 2021 and has fallen by 29% since.
Found this lebron in Greece...
August 16, 2025 at 8:57 PM
Found this lebron in Greece...
Remember when I made 3k in $TSLA while in vacation in Monaco
August 15, 2025 at 8:35 PM
Remember when I made 3k in $TSLA while in vacation in Monaco
Craziest Yatch have ever be in.....
August 15, 2025 at 10:13 AM
Craziest Yatch have ever be in.....
When she don't know the value of the gift you bought her.... Did she commit a crime?
August 14, 2025 at 6:13 PM
When she don't know the value of the gift you bought her.... Did she commit a crime?
Time to requisition a name change.... "Door Crawl" 😂

August 14, 2025 at 12:08 AM
Time to requisition a name change.... "Door Crawl" 😂
Two passport, one love story.... from sunrise to sunset is always us.
August 14, 2025 at 12:02 AM
Two passport, one love story.... from sunrise to sunset is always us.
Fire the CEO. He is lost in Politics.

July 7, 2025 at 10:35 PM
Fire the CEO. He is lost in Politics.
$SPX 6246 didnt hold. 6200 tested. 6177 can be a spot to look for buys. Will see tomorrow.
July 7, 2025 at 10:34 PM
$SPX 6246 didnt hold. 6200 tested. 6177 can be a spot to look for buys. Will see tomorrow.
If you’ve got a young family, buy a boat.

July 7, 2025 at 12:39 AM
If you’ve got a young family, buy a boat.
Chart of $QQQ With Previous times NAAIM Reading Was over 100:
Worth Reviewing With Charts Attached:
1) March 13th 2024
2) March 27th 2024
3) July 3rd 2024
4) December 11th 2024
Worth Reviewing With Charts Attached:
1) March 13th 2024
2) March 27th 2024
3) July 3rd 2024
4) December 11th 2024


July 3, 2025 at 5:19 PM
Chart of $QQQ With Previous times NAAIM Reading Was over 100:
Worth Reviewing With Charts Attached:
1) March 13th 2024
2) March 27th 2024
3) July 3rd 2024
4) December 11th 2024
Worth Reviewing With Charts Attached:
1) March 13th 2024
2) March 27th 2024
3) July 3rd 2024
4) December 11th 2024
Hit $1M profit month to date earlier in the morning before the $SPY drop!
If I can do it, anyone can , but it takes finding a process that works for you and staying disciplined until it becomes second nature!
If I can do it, anyone can , but it takes finding a process that works for you and staying disciplined until it becomes second nature!

July 1, 2025 at 4:59 PM
Hit $1M profit month to date earlier in the morning before the $SPY drop!
If I can do it, anyone can , but it takes finding a process that works for you and staying disciplined until it becomes second nature!
If I can do it, anyone can , but it takes finding a process that works for you and staying disciplined until it becomes second nature!
I am traveling next week so my updates will be limited here.
$SPX One may be eager to short this double top but there is no setup yet. Top formations can take a little bit of time or this rally can continue. It will take a few days and with the short week ahead of us, I'm not expecting any major shift in the trend.

July 1, 2025 at 4:34 PM
I am traveling next week so my updates will be limited here.
$SPX One may be eager to short this double top but there is no setup yet. Top formations can take a little bit of time or this rally can continue. It will take a few days and with the short week ahead of us, I'm not expecting any major shift in the trend.
July 1, 2025 at 4:25 PM
$SPX One may be eager to short this double top but there is no setup yet. Top formations can take a little bit of time or this rally can continue. It will take a few days and with the short week ahead of us, I'm not expecting any major shift in the trend.
Camp set for what should be an amazing weekend kiteboarding in the Mohave Desert.

June 28, 2025 at 3:37 PM
Camp set for what should be an amazing weekend kiteboarding in the Mohave Desert.