Mehmet Göktuğ Öztürk
@mehmetgoktug.bsky.social
42 followers 220 following 2 posts
Ecologist | Fire Ecology | Biogeography | Spatial Data Analysis | Birdwatching | Open and Reproducible Science
Posts Media Videos Starter Packs
Reposted by Mehmet Göktuğ Öztürk
jakubnowosad.com
🌍Exploring Sentinel-2 with the Copernicus Data Space Ecosystem (CDSE)?

Hugh Graham’s guide with vrtility in #rstats. Includes authentication & query of imagery and building cloud-free composites.

permian-global-research.github.io/vrtility/art...

#RSpatial #RemoteSensing #EarthObservation #GIS
Reposted by Mehmet Göktuğ Öztürk
nowosad.fosstodon.org.ap.brid.gy
Starting out with geographic data in Python? 🌍🐍

Chapter 1 of Geocomputation with Python introduces vector & raster models + core tools (geopandas, shapely, rasterio).

👉 https://py.geocompx.org/01-spatial-data

#geopython #python #gischat
Reposted by Mehmet Göktuğ Öztürk
funecolhu.bsky.social
Our Fieldwork in Beytepe🌿
To identify the distribution of Ailanthus altissima, examine its changes over the years, and predict its future dynamics, we carried out fieldwork at Hacettepe University’s Beytepe Campus
Together with our intern team, we collected data in the pilot area of our research. 🌸
Reposted by Mehmet Göktuğ Öztürk
tomhengl.bsky.social
Had a privilege and pleasure to teach terra pkg (created by @roberthijmans.bsky.social et al.) and spatial sampling with R together with Alexandre Wadoux at the #EOSummerSchool2025 at WICC. You can follow the terra tutorial from here: differ.blog/p/processing...
📹: youtu.be/q9sQkg7BeAc?...
Processing large rasters using terra package for R: combining tiling and time-series modeling
differ.blog
Reposted by Mehmet Göktuğ Öztürk
gmcd.bsky.social
I had a blast at #useR2025.

Here are my slides on `tinyplot`. grantmcdermott.com/tinyplot/vig...

(Rendering of the title slide is a bit off on mobile. I'll fix when when I get sec.)
tinyplot –
grantmcdermott.com
Reposted by Mehmet Göktuğ Öztürk
eddelbuettel.com
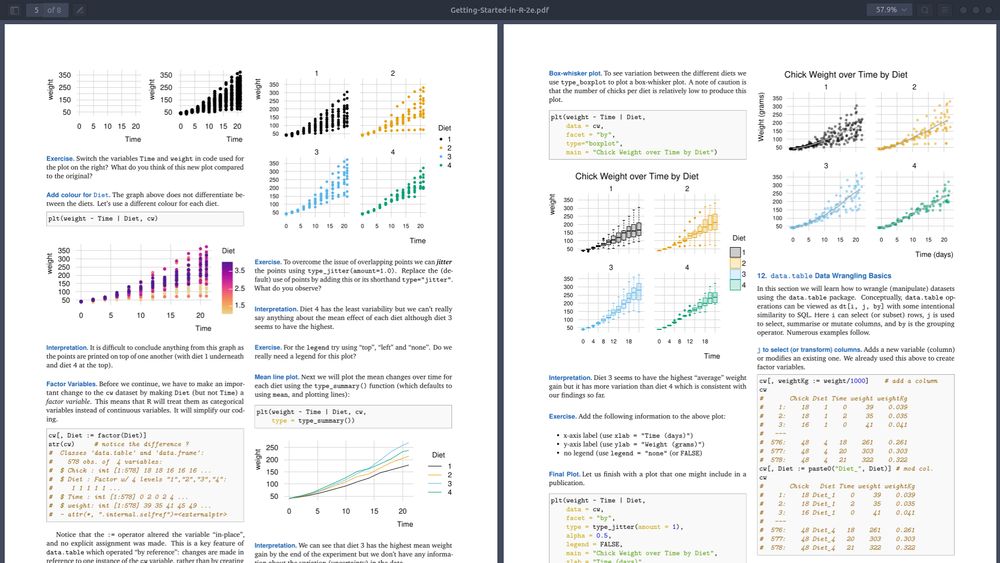
The "Getting Started in R - Tinyverse Edition" eight-page pdf guide now has a 2nd edition using, appropriately, `tinyplot` as the plotting package.

See github.com/eddelbuettel... for more.

#rstats
Screenshot of the top parts of pages 5 and 6 of 'Getting Started in R - Tinyverse Edition' at https://github.com/eddelbuettel/gsir-te/
Reposted by Mehmet Göktuğ Öztürk
posit.co
Posit @posit.co · Aug 6
Check out Positron’s Plots Pane!

Preview, resize, copy, and save your #Python and #RStats plots directly in your IDE. Never guess what your exported plot will look like ever again 🤩

Learn more about Positron’s layout: positron.posit.co/layout.html#... #Positron
Reposted by Mehmet Göktuğ Öztürk
econmaett.github.io
Bias Variance Tradeoff interactive visualization by Jared Wilber & Brent Werness 😃
mlu-explain.github.io/bias-variance/
#dataviz #stats
At different levels of complexity, a sample of model realizations alongside their corresponding prediction error decompositions
Source: https://mlu-explain.github.io/bias-variance/ The bias variance tradeoff for LOESS may be controlled for via the smoothness parameter. When the smoothness is small, the amount of data we consider is insufficient for an accurate fit, resulting in large variance. However, if we make the smoothness too high (i.e. over-smoothed), we trade local information for global, resulting in large bias.
Reposted by Mehmet Göktuğ Öztürk
etiennebacher.bsky.social
#rstats polars 1.0.0 is now available!

polars provides bindings to the eponymous Rust library, a very efficient dataframe library.

This is the outcome of a 1-year long rewrite led by @eitsupi to refactor the internals and match the API of Python polars.

pola-rs.github.io/r-polars/

Details ⬇️
Polars R Package
pola-rs.github.io
Reposted by Mehmet Göktuğ Öztürk
jakubnowosad.com
Have you read Geocomputation with R?📘
If you found it helpful, we’d really appreciate a quick review — it helps others find the book too!

Goodreads: www.goodreads.com/book/show/21...
Amazon: www.amazon.com/dp/1032248882
Book: r.geocompx.org

#rstats #gis #geocompx #rspatial
The book cover
mehmetgoktug.bsky.social
This award means a lot to me, and I’m truly grateful to my advisors, @ctavsanoglu.bsky.social and @fire-ecologist.bsky.social, for their invaluable guidance and support throughout this journey.
mehmetgoktug.bsky.social
I'm thrilled to share some wonderful news with you today!
My master’s thesis, “Spatiotemporal Patterns of Lightning-Induced Wildfires in Turkey”, has received the Best Master's Thesis Award from the Ecology and Evolutionary Biology Society of Türkiye - EkoEvo!
Reposted by Mehmet Göktuğ Öztürk
jakubnowosad.com
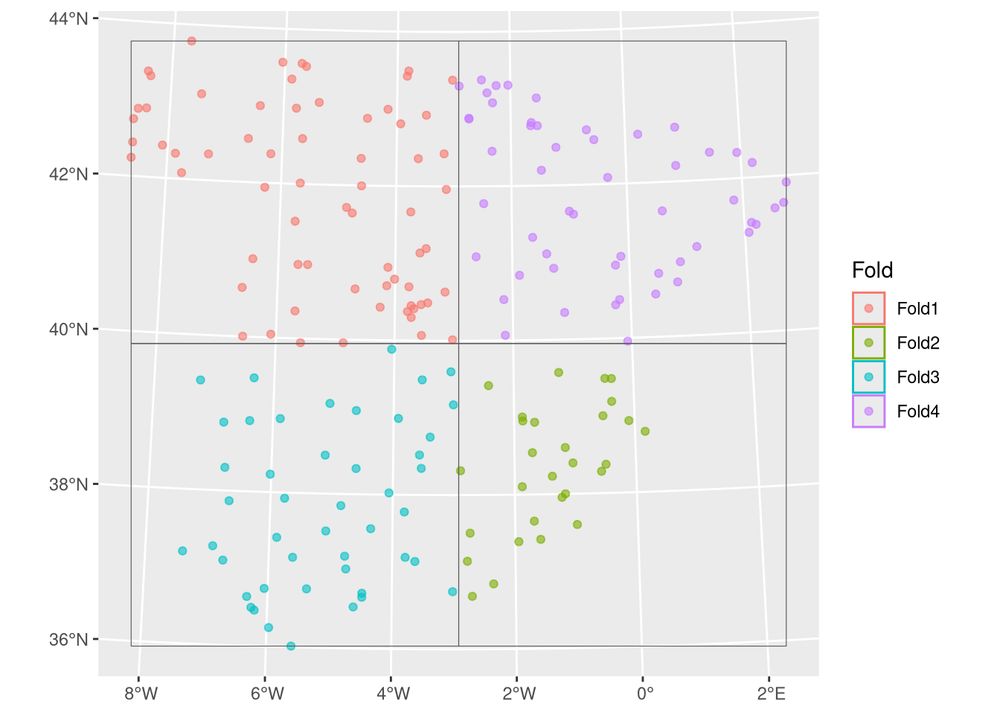
🚨 Final part of our Spatial ML with R series ! 🚨

We explore spatial cross-validation with sperrorest & blockCV — tools outside the usual ML frameworks 📦

URL: geocompx.org/post/2025/sm...

#rstats #SpatialML #rspatial
Reposted by Mehmet Göktuğ Öztürk
jgpausas.bsky.social
"Aspen (Populus tremuloides) slows fire progression: as aspen cover on the landscape increased, daily area burned and linear spread rate decreased." Harris et al. #EcolAppl @esajournals.bsky.social 🧪🌍🔥🌳🪴
#Flammability matters!

esajournals.onlinelibrary.wiley.com/doi/10.1002/...
grumpyunclesean.bsky.social
1/4

Our research team just published a new paper: "Aspen impedes wildland fire spread in southwestern United States landscapes".

Aspen forests are thought to be more resistant to burning compared to conifer forests, but this has not been well studied.
🧪🔥
Aspen impedes wildfire spread in southwestern United States landscapes
Aspen (Populus tremuloides) forests are generally thought to impede fire spread, yet the extent of this effect is not well quantified in relation to other vegetation types. We examined the influence ...
doi.org
Reposted by Mehmet Göktuğ Öztürk
bbolker.bsky.social
I like this paper too, but (horn-tooting alert) alternatively, consider not doing model selection at all? doi.org/10.3390/e260... (FWIW I do feel a bit bad about publishing in an MDPI special issue [!!] - long story, I agreed to do it and then felt uncomfortable backing out - wouldn't do it again)
Multimodel Approaches Are Not the Best Way to Understand Multifactorial Systems
Information-theoretic (IT) and multi-model averaging (MMA) statistical approaches are widely used but suboptimal tools for pursuing a multifactorial approach (also known as the method of multiple work...
doi.org
Reposted by Mehmet Göktuğ Öztürk
jonocarroll.fosstodon.org.ap.brid.gy
New post: https://jcarroll.com.au/2025/06/29/counting-digits-quickly/

What if you could just wave a magic wand over your R #rstast :rstats: code and have it transform into something that ran as fast as or faster than C? @t_kalinowski's {quickr} 'R to Fortran Transpiler' does that for you! […]
Original post on fosstodon.org
fosstodon.org
Reposted by Mehmet Göktuğ Öztürk
shikokuchuo.net
Bleeding edge update for the #tidyverse purrr package with even more seamless #rstats parallel maps.

Introducing our shiniest new adverb: `in_parallel()`. Just wrap your function to take advantage of blazing fast parallel processing via mirai.

pak::pak("tidyverse/purrr")

purrr.tidyverse.org/dev/
Functional Programming Tools
A complete and consistent functional programming toolkit for R.
purrr.tidyverse.org
Reposted by Mehmet Göktuğ Öztürk

jakubnowosad.com
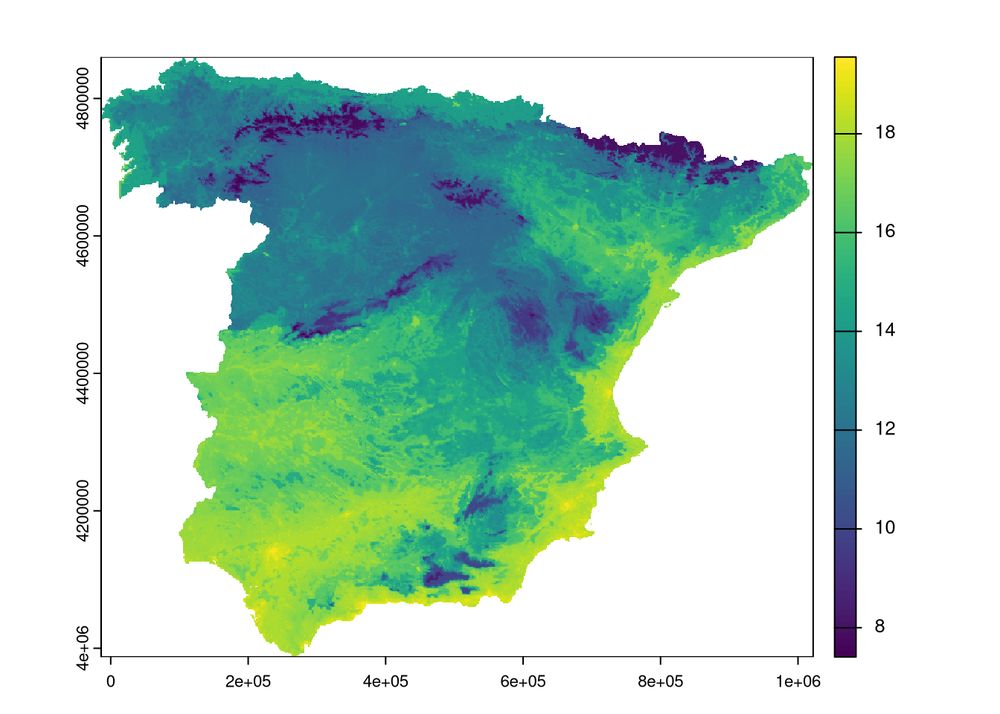
New blog post: Spatial Machine Learning with tidymodels 🌍🧠📦

This post shows how to apply the tidymodels framework to spatial data workflows in R. Part 3 in a series about #sml.

🔗 geocompx.org/post/2025/sm...

#rstats #rspatial #tidymodels #gischat
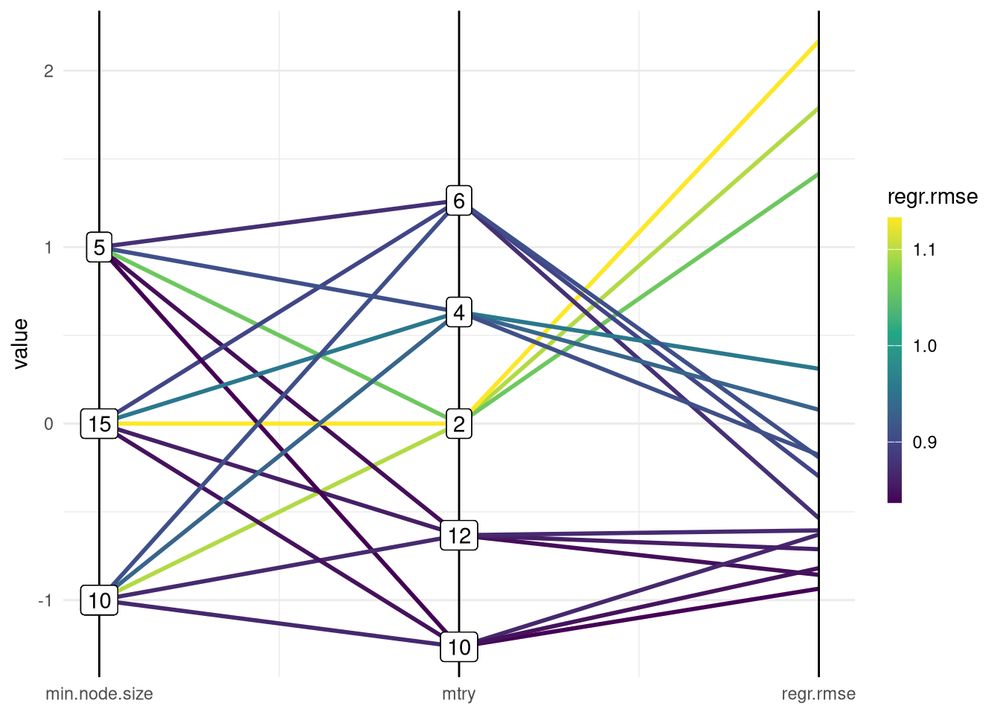
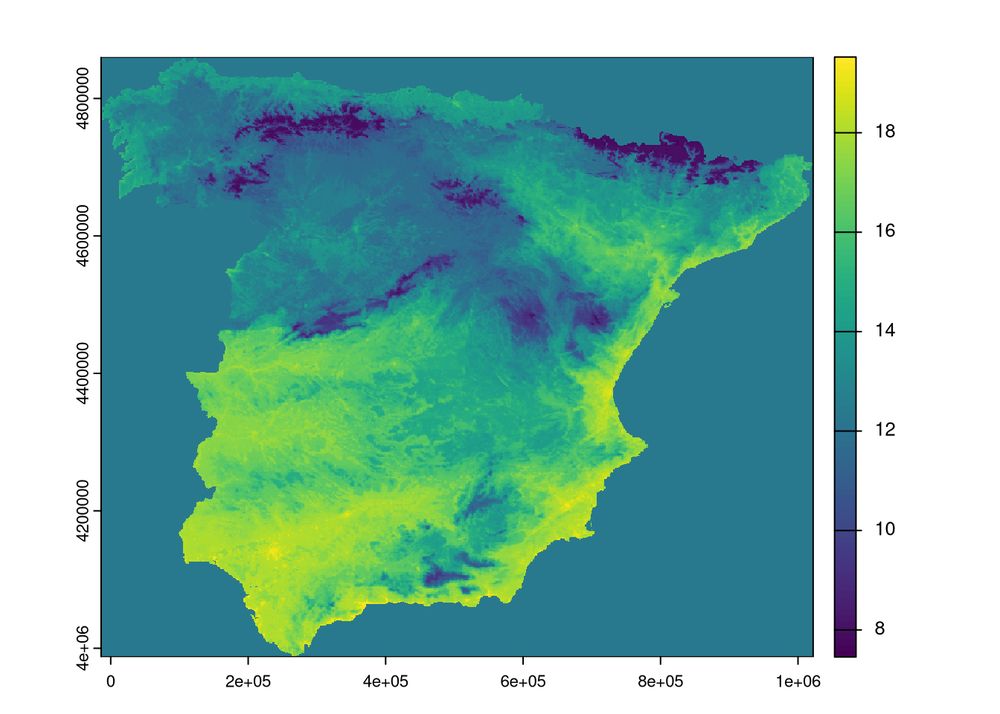
A screenshot from the blog post A screenshot from the blog post A screenshot from the blog post A screenshot from the blog post
Reposted by Mehmet Göktuğ Öztürk

jakubnowosad.com
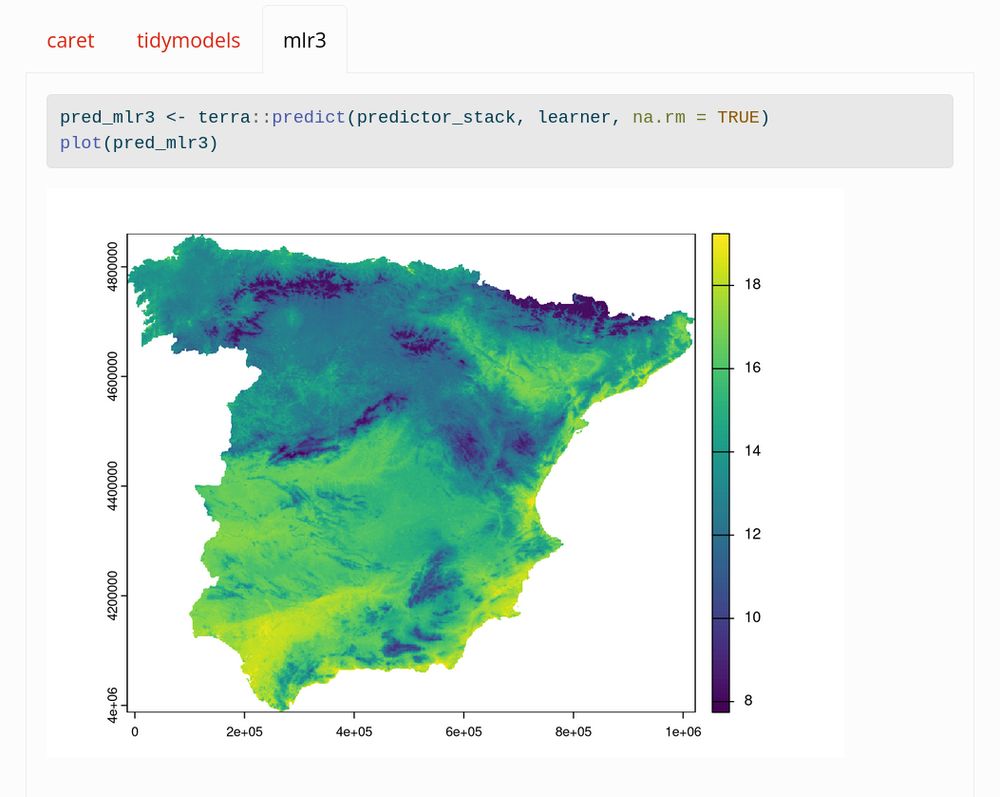
Spatial prediction meets machine learning with mlr3 💡🌍
This blog post by Marvin Ludwig also includes tips on autocorrelation, extrapolation & more.

🔗 geocompx.org/post/2025/sm...

#mlr3 #rstats #gischat #rspatial
Reposted by Mehmet Göktuğ Öztürk
hadley.nz
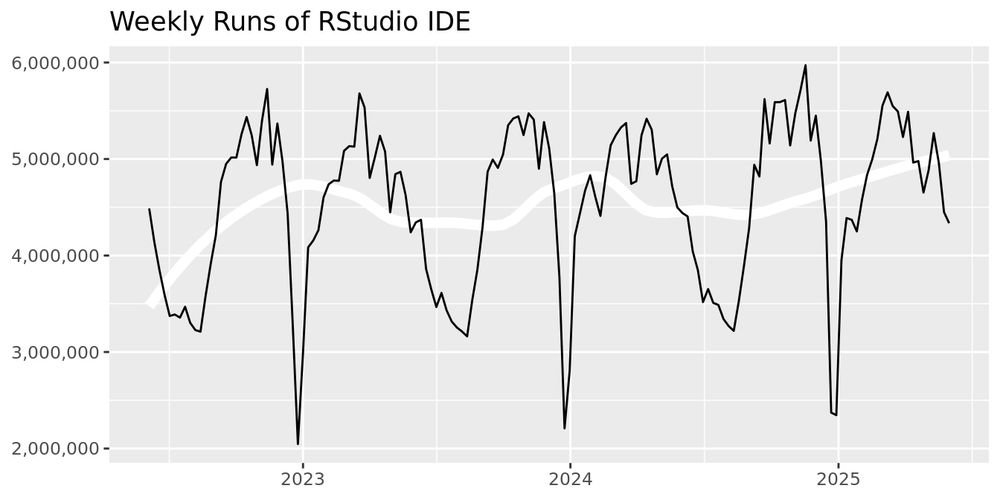
Is #rstats dead? I don’t think so.
Line chart titled ‘Weekly Runs of RStudio IDE’ showing usage data from 2023 to 2025. The y-axis ranges from 2,000,000 to 6,000,000 weekly runs. The chart displays a cyclical pattern with regular peaks around 5,000,000-6,000,000 runs and dramatic drops to approximately 2,000,000 runs that occur periodically during holiday periods.
Reposted by Mehmet Göktuğ Öztürk
jakubnowosad.com
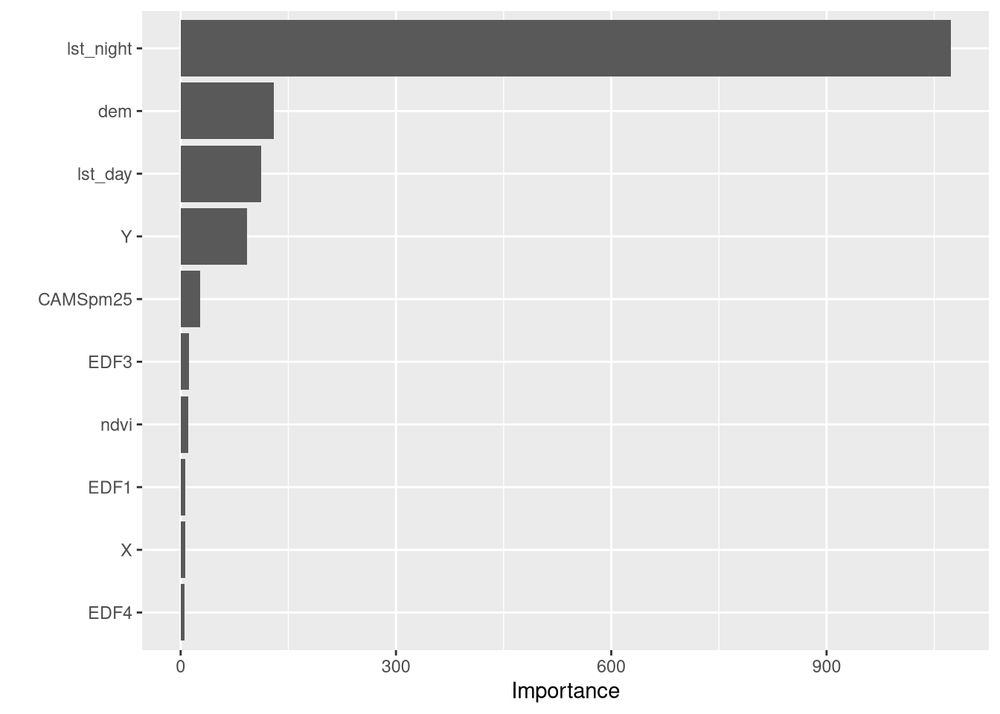
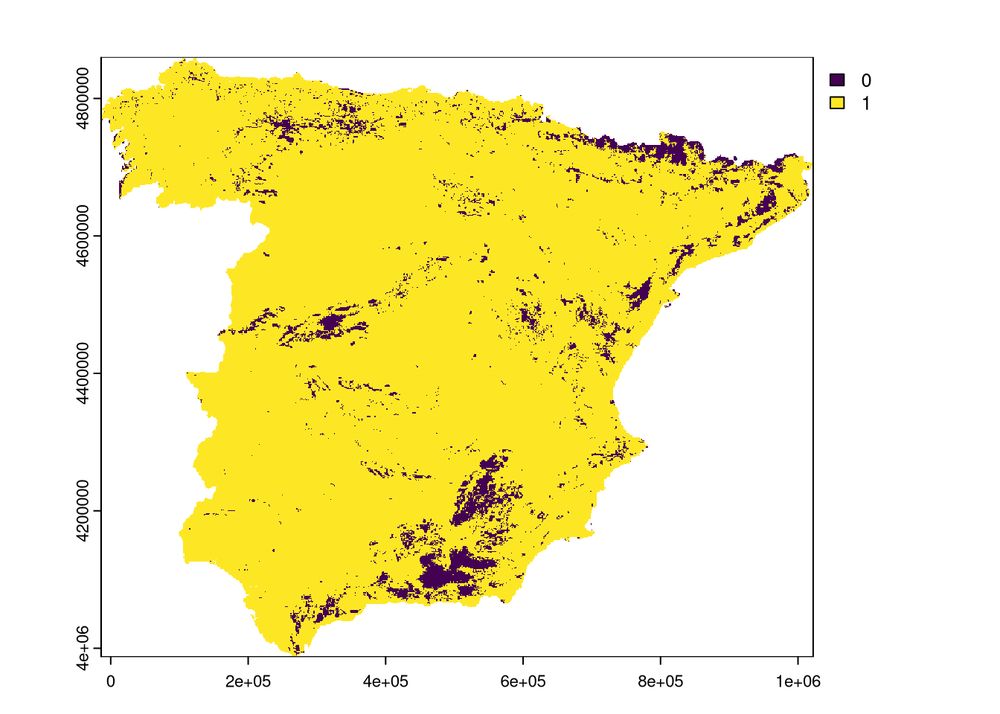
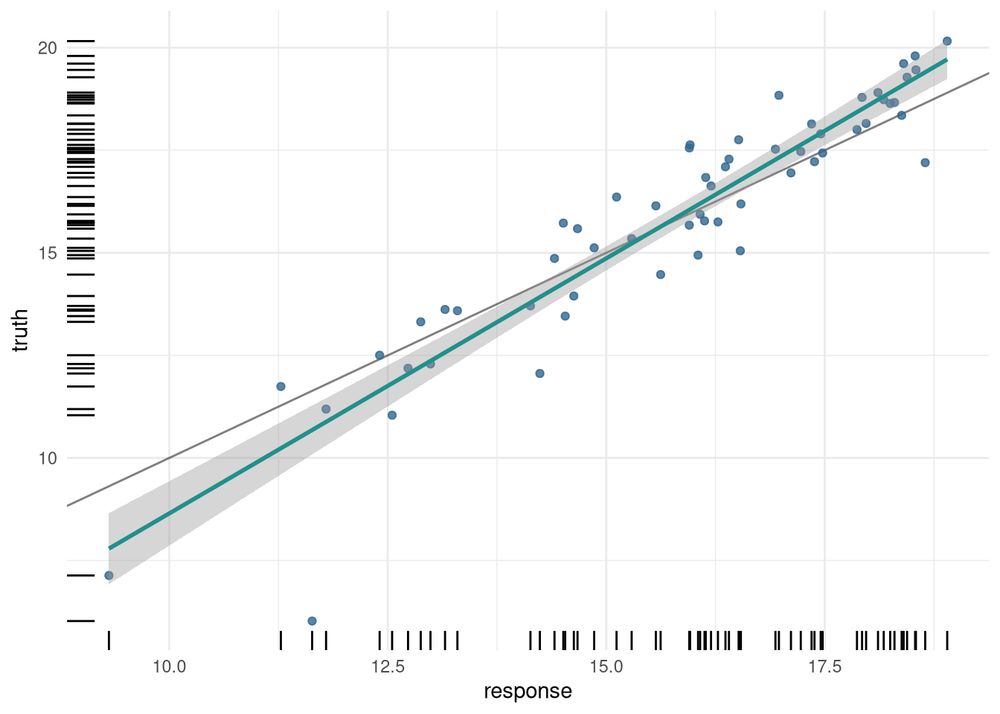
🔍 Interested in spatial machine learning with R?🌍
We compare caret, tidymodels, and mlr3 for spatial tasks — and show how their workflows differ.

Read it here: geocompx.org/post/2025/sm...

#MachineLearning #SpatialAnalysis #RStats #rspatial
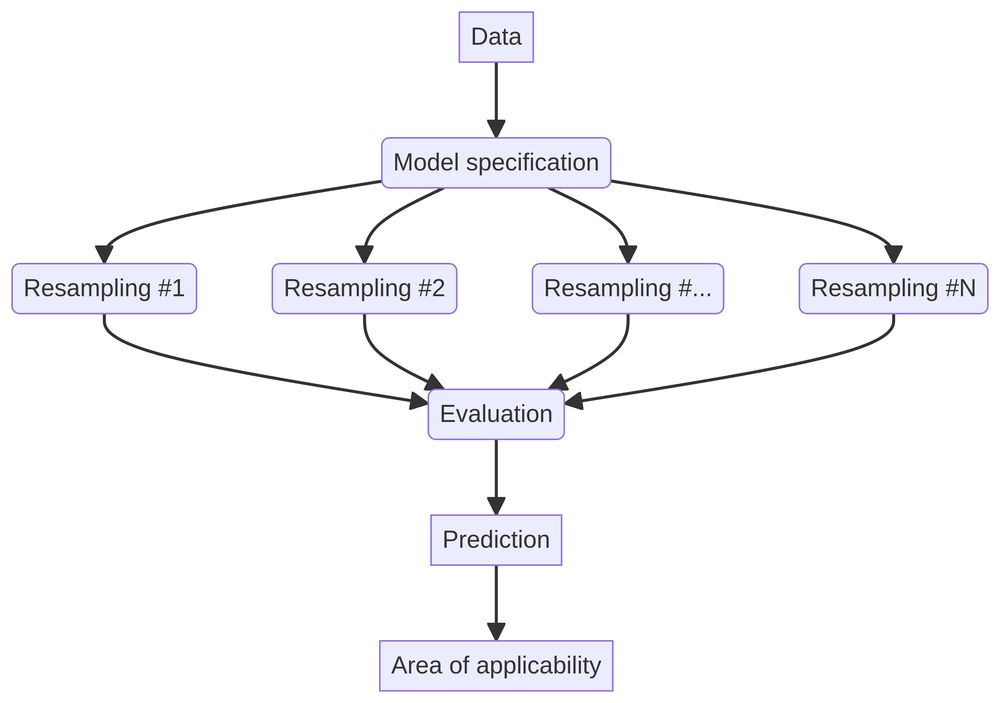
 A possible workflow of the spatial machine learning task. A screenshot of a part of the blog post
Reposted by Mehmet Göktuğ Öztürk
frodsan.bsky.social
Actual code sharing remains terribly low in ecology (source: doi.org/10.1002/ece3...)
Temporal trends of open-access publications (open publication), open data, and code sharing (open code) between 2010 and 2022. Sample size was 77 papers per year, 1001 total. The lines show trends in each open-science component over time, with dashed lines representing non-significant trends, and solid lines indicating significance. Open data (p = 1.48e-06) and code sharing (p = .00157) increased significantly over time, while open-access publications (p = .926) had no statistically significant relationship.
Reposted by Mehmet Göktuğ Öztürk
hadley.nz
What advice do folks have for organising projects that will be deployed to production? How do you organise your directories? What do you do if you're deploying multiple "things" (e.g. an app and an api) from the same project?
Reposted by Mehmet Göktuğ Öztürk
jakubnowosad.com
Thank you to everyone who has already supported our work on open-source spatial analysis resources like Geocomputation with R/Python! 🙏🌍

If you’ve found our books helpful, consider supporting future updates and free resources: buff.ly/3OMFPUU

<span
class="text-blue-600 dark:text-sky-400">#rstats #rspatial #geopython #geocompx