


Nicola Rennie
@nrennie.bsky.social
📊 Data visualisation specialist.
💻 #RStats | #Python | #D3.
🎨 Generative artist.
🏃♀️ Runner.
Website: https://nrennie.rbind.io/
She/her. Views my own.
💻 #RStats | #Python | #D3.
🎨 Generative artist.
🏃♀️ Runner.
Website: https://nrennie.rbind.io/
She/her. Views my own.
Pinned
Nicola Rennie
@nrennie.bsky.social
· Sep 11

Introducing The Art of Visualization with ggplot2 – Nicola Rennie
I’ve written a book! This blog post gives a brief introduction to The Art of Visualization with ggplot2, a book of data visualization case studies showing the end-to-end process of building charts, st...
nrennie.rbind.io
I've written a short blog post introducing "The Art of Visualization with ggplot2"!
This book is all about the end-to-end process of creating charts with #ggplot2 📊 including data wrangling, sketching, and styling your plots!
nrennie.rbind.io/blog/art-of-...
#RStats #DataViz #TidyTuesday
This book is all about the end-to-end process of creating charts with #ggplot2 📊 including data wrangling, sketching, and styling your plots!
nrennie.rbind.io/blog/art-of-...
#RStats #DataViz #TidyTuesday
Reposted by Nicola Rennie

🚨 New #DataViz post!
I explore smart alternatives to a broken chart and highlight why avoiding bad practices matters.
👉 Which alternative do you prefer? Let us know in the comments!
#rstats
dominicroye.github.io/blog/2025-12...
I explore smart alternatives to a broken chart and highlight why avoiding bad practices matters.
👉 Which alternative do you prefer? Let us know in the comments!
#rstats
dominicroye.github.io/blog/2025-12...

Broken Chart: discover 9 visualization alternatives
Researcher in climate science at MBG-CSIC
dominicroye.github.io
December 15, 2025 at 9:02 AM
🚨 New #DataViz post!
I explore smart alternatives to a broken chart and highlight why avoiding bad practices matters.
👉 Which alternative do you prefer? Let us know in the comments!
#rstats
dominicroye.github.io/blog/2025-12...
I explore smart alternatives to a broken chart and highlight why avoiding bad practices matters.
👉 Which alternative do you prefer? Let us know in the comments!
#rstats
dominicroye.github.io/blog/2025-12...
Reposted by Nicola Rennie

I presume you are already familiar with the pleasures of /r/ididnthaveeggs

I Didn't Have Eggs: Terrible recipe reviews • r/ididnthaveeggs
Reviews by people who don't follow a recipe and then complain that it sucks.
old.reddit.com
December 15, 2025 at 7:15 AM
I presume you are already familiar with the pleasures of /r/ididnthaveeggs
Reposted by Nicola Rennie

This is not funny at all

December 9, 2025 at 9:10 PM
This is not funny at all
Reposted by Nicola Rennie

Insightful post by @darraghmurray.bsky.social about the public backlash when the Australian Bureau of Meteorology changed the color palette for rain radar data:
thedatavist.substack.com/p/colour-as-...
#dataviz #cartography 📊🗺️
thedatavist.substack.com/p/colour-as-...
#dataviz #cartography 📊🗺️

Colour as Strategy and Aesthetics: What the Bureau of Meteorology’s Radar Teaches About Data Visualisation
An ill-fated radar redesign reminds us that colour decisions are never cosmetic, they define how data is read and believed.
thedatavist.substack.com
December 5, 2025 at 4:22 PM
Insightful post by @darraghmurray.bsky.social about the public backlash when the Australian Bureau of Meteorology changed the color palette for rain radar data:
thedatavist.substack.com/p/colour-as-...
#dataviz #cartography 📊🗺️
thedatavist.substack.com/p/colour-as-...
#dataviz #cartography 📊🗺️
There's some incredible maps at the National Library of Scotland - including this one which is over 450 years old! 🏴
(North arrow points right in this map ➡️)
(North arrow points right in this map ➡️)

December 13, 2025 at 11:11 AM
There's some incredible maps at the National Library of Scotland - including this one which is over 450 years old! 🏴
(North arrow points right in this map ➡️)
(North arrow points right in this map ➡️)
Reposted by Nicola Rennie

The worst charts I've ever seen at work


December 10, 2025 at 9:39 AM
The worst charts I've ever seen at work
Reposted by Nicola Rennie

Made a site comparing the sizes of living things :)
The great Julius Csotonyi spent 5 months painting over 60 illustrations for the site, no ai used
> neal.fun/size-of-life/
The great Julius Csotonyi spent 5 months painting over 60 illustrations for the site, no ai used
> neal.fun/size-of-life/
December 10, 2025 at 4:03 PM
Made a site comparing the sizes of living things :)
The great Julius Csotonyi spent 5 months painting over 60 illustrations for the site, no ai used
> neal.fun/size-of-life/
The great Julius Csotonyi spent 5 months painting over 60 illustrations for the site, no ai used
> neal.fun/size-of-life/
Reposted by Nicola Rennie

Hello! I'm back to talk about R community. This is a thread about @rainbowr.org, a community for LGBTQ+ folks who code in R 🌈
I know previous RoCurs have talked about rainbowR, but as the co-founder and co-lead of the community, I can't not write this thread!
rainbowr.org
I know previous RoCurs have talked about rainbowR, but as the co-founder and co-lead of the community, I can't not write this thread!
rainbowr.org
rainbowR
rainbowr.org
December 11, 2025 at 3:20 PM
Hello! I'm back to talk about R community. This is a thread about @rainbowr.org, a community for LGBTQ+ folks who code in R 🌈
I know previous RoCurs have talked about rainbowR, but as the co-founder and co-lead of the community, I can't not write this thread!
rainbowr.org
I know previous RoCurs have talked about rainbowR, but as the co-founder and co-lead of the community, I can't not write this thread!
rainbowr.org
Reposted by Nicola Rennie

I just need 1 more dataset for #TidyTuesday 2025! Thank you so much to those of you who have submitted datasets!
The submissions have allowed me to make progress on a long-planned huge maintainability and usability improvement for TT, coming in 2026!
The submissions have allowed me to make progress on a long-planned huge maintainability and usability improvement for TT, coming in 2026!
December 8, 2025 at 12:12 PM
I just need 1 more dataset for #TidyTuesday 2025! Thank you so much to those of you who have submitted datasets!
The submissions have allowed me to make progress on a long-planned huge maintainability and usability improvement for TT, coming in 2026!
The submissions have allowed me to make progress on a long-planned huge maintainability and usability improvement for TT, coming in 2026!
Reposted by Nicola Rennie
One final contributing to base R post from me today, sharing a blog post from Rhian on her experience of participating in an R Dev Day.
rhian.rbind.io/posts/2025-1...
@statsrhian.bsky.social #RStats
rhian.rbind.io/posts/2025-1...
@statsrhian.bsky.social #RStats
My First Contribution to base R – Rhian Davies
How an R Dev Day helped me go from feeling intimidated by base R to making my first small contribution.
rhian.rbind.io
December 10, 2025 at 6:05 PM
One final contributing to base R post from me today, sharing a blog post from Rhian on her experience of participating in an R Dev Day.
rhian.rbind.io/posts/2025-1...
@statsrhian.bsky.social #RStats
rhian.rbind.io/posts/2025-1...
@statsrhian.bsky.social #RStats
Reposted by Nicola Rennie

The R Foundation is happy to be a partner on the project
"Enabling the next generation of R contributors"
awarded £500k under the Research Software Maintenance Fund (Software Sustainability Institute, UK).
Announcement: www.software.ac.uk/ssi-awards-f...
Congratulations to the project team!
"Enabling the next generation of R contributors"
awarded £500k under the Research Software Maintenance Fund (Software Sustainability Institute, UK).
Announcement: www.software.ac.uk/ssi-awards-f...
Congratulations to the project team!
SSI awards funding to 13 projects through the RSMF Round 1 | Software Sustainability Institute
We are pleased to announce that the Research Software Maintenance Fund (RSMF) has funded 13 projects to advance the sustainability and impact of research software. Through this initiative, the SSI, wi...
www.software.ac.uk
December 10, 2025 at 8:01 PM
The R Foundation is happy to be a partner on the project
"Enabling the next generation of R contributors"
awarded £500k under the Research Software Maintenance Fund (Software Sustainability Institute, UK).
Announcement: www.software.ac.uk/ssi-awards-f...
Congratulations to the project team!
"Enabling the next generation of R contributors"
awarded £500k under the Research Software Maintenance Fund (Software Sustainability Institute, UK).
Announcement: www.software.ac.uk/ssi-awards-f...
Congratulations to the project team!
Here's a little round up of my 2025 year in #DataViz featuring
💜 Some of my favourite #RStats charts
💜 A look back at 5 years of #TidyTuesday
💜 Links to cool #QuartoPub and visualisation things I've seen this year
Link: nrennie.rbind.io/blog/year-in...
💜 Some of my favourite #RStats charts
💜 A look back at 5 years of #TidyTuesday
💜 Links to cool #QuartoPub and visualisation things I've seen this year
Link: nrennie.rbind.io/blog/year-in...

My year in data visualisation – Nicola Rennie
A round up of my projects this year, highlighting some of my favourite charts from 2025, and looking back on five years of TidyTuesday contributions.
nrennie.rbind.io
December 10, 2025 at 1:41 PM
Here's a little round up of my 2025 year in #DataViz featuring
💜 Some of my favourite #RStats charts
💜 A look back at 5 years of #TidyTuesday
💜 Links to cool #QuartoPub and visualisation things I've seen this year
Link: nrennie.rbind.io/blog/year-in...
💜 Some of my favourite #RStats charts
💜 A look back at 5 years of #TidyTuesday
💜 Links to cool #QuartoPub and visualisation things I've seen this year
Link: nrennie.rbind.io/blog/year-in...
Reposted by Nicola Rennie

Big new blogpost!
My guide to data visualization, which includes a very long table of contents, tons of charts, and more.
--> Why data visualization matters and how to make charts more effective, clear, transparent, and sometimes, beautiful.
www.scientificdiscovery.dev/p/salonis-gu...
My guide to data visualization, which includes a very long table of contents, tons of charts, and more.
--> Why data visualization matters and how to make charts more effective, clear, transparent, and sometimes, beautiful.
www.scientificdiscovery.dev/p/salonis-gu...

December 9, 2025 at 8:28 PM
Big new blogpost!
My guide to data visualization, which includes a very long table of contents, tons of charts, and more.
--> Why data visualization matters and how to make charts more effective, clear, transparent, and sometimes, beautiful.
www.scientificdiscovery.dev/p/salonis-gu...
My guide to data visualization, which includes a very long table of contents, tons of charts, and more.
--> Why data visualization matters and how to make charts more effective, clear, transparent, and sometimes, beautiful.
www.scientificdiscovery.dev/p/salonis-gu...
Reposted by Nicola Rennie

Today in small mercies (via r-devel)

December 9, 2025 at 5:37 PM
Today in small mercies (via r-devel)
Reposted by Nicola Rennie

#dataviz #maps A fabulous way to explore #history interactively:
Choose topics (wars, inventions, discoveries, literature), time periods, ... and see what pops up.
www.globeofhistory.com
Choose topics (wars, inventions, discoveries, literature), time periods, ... and see what pops up.
www.globeofhistory.com

Globe of History – Interactive Historical Events Map
Explore 6,000 years of battles, inventions, philosophers and more... on an interactive 3D globe.
www.globeofhistory.com
December 9, 2025 at 2:54 PM
#dataviz #maps A fabulous way to explore #history interactively:
Choose topics (wars, inventions, discoveries, literature), time periods, ... and see what pops up.
www.globeofhistory.com
Choose topics (wars, inventions, discoveries, literature), time periods, ... and see what pops up.
www.globeofhistory.com
Reposted by Nicola Rennie
Today I'm talking about contributing to base R 💻
Are you curious about how to improve the language we love, at its core?
This is a thread for you!
#RStats
Are you curious about how to improve the language we love, at its core?
This is a thread for you!
#RStats
December 9, 2025 at 10:39 AM
Today I'm talking about contributing to base R 💻
Are you curious about how to improve the language we love, at its core?
This is a thread for you!
#RStats
Are you curious about how to improve the language we love, at its core?
This is a thread for you!
#RStats
We're looking at cars in Qatar for #TidyTuesday this week - "an international and modern version of the now-ancient `mtcars`" data! 📊
➡️ 9 ways to visualise the distribution of a variable
Thanks to @andrew.heiss.phd for curating this week's dataset!
#RStats #DataViz
➡️ 9 ways to visualise the distribution of a variable
Thanks to @andrew.heiss.phd for curating this week's dataset!
#RStats #DataViz

December 9, 2025 at 10:51 AM
We're looking at cars in Qatar for #TidyTuesday this week - "an international and modern version of the now-ancient `mtcars`" data! 📊
➡️ 9 ways to visualise the distribution of a variable
Thanks to @andrew.heiss.phd for curating this week's dataset!
#RStats #DataViz
➡️ 9 ways to visualise the distribution of a variable
Thanks to @andrew.heiss.phd for curating this week's dataset!
#RStats #DataViz
Reposted by Nicola Rennie

How do large language models interpret words relating to probability like “unlikely,” “probably,” or “almost certain"?
The below shows what happens when we compare judgements from different models to a benchmark dataset of human judgments (data from: github.com/zonination/p...).
The below shows what happens when we compare judgements from different models to a benchmark dataset of human judgments (data from: github.com/zonination/p...).

December 8, 2025 at 9:42 AM
How do large language models interpret words relating to probability like “unlikely,” “probably,” or “almost certain"?
The below shows what happens when we compare judgements from different models to a benchmark dataset of human judgments (data from: github.com/zonination/p...).
The below shows what happens when we compare judgements from different models to a benchmark dataset of human judgments (data from: github.com/zonination/p...).
Reposted by Nicola Rennie

Ah fuck it. In an expression of my frustration at having been unable to focus on things I actually *want* to talk about, I wrapped up this little blog post about managing git/github configurations for multiple identities on the one computer. As always, read it or don't :)
Two githubs, one laptop – Notes from a data witch
Some notes on managing multiple sets of github credentials on the one machine
blog.djnavarro.net
December 7, 2025 at 9:46 PM
Ah fuck it. In an expression of my frustration at having been unable to focus on things I actually *want* to talk about, I wrapped up this little blog post about managing git/github configurations for multiple identities on the one computer. As always, read it or don't :)
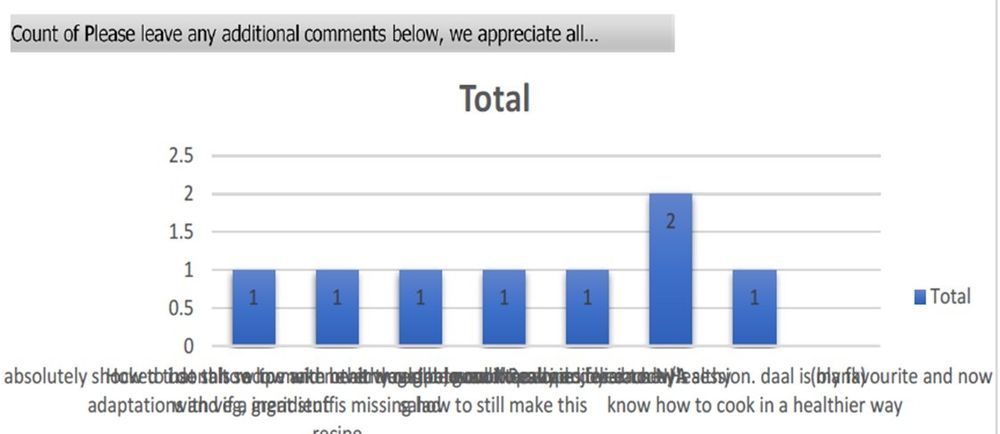
One of the things I talked about in last week's #DataViz workshop is that sometimes you have an idea for a chart and sketch it out, but you don't know whether it will actually work until you try it with the real data. 🧵1/5
#RStats #ggplot2 #TidyTuesday
#RStats #ggplot2 #TidyTuesday


December 7, 2025 at 5:48 PM
One of the things I talked about in last week's #DataViz workshop is that sometimes you have an idea for a chart and sketch it out, but you don't know whether it will actually work until you try it with the real data. 🧵1/5
#RStats #ggplot2 #TidyTuesday
#RStats #ggplot2 #TidyTuesday
Reposted by Nicola Rennie

HEY! YOU! ggdibbler 0.6.1 is finally up on CRAN!
harriet-mason.github.io/ggdibbler/in...
You can now pass random variables to any aesthetic in any ggplot geom/stat. If you can express it as a distribution, ggdibbler can plot it. It also works with ggplot extensions, like gganimate. #rstats
harriet-mason.github.io/ggdibbler/in...
You can now pass random variables to any aesthetic in any ggplot geom/stat. If you can express it as a distribution, ggdibbler can plot it. It also works with ggplot extensions, like gganimate. #rstats

December 6, 2025 at 3:16 PM
HEY! YOU! ggdibbler 0.6.1 is finally up on CRAN!
harriet-mason.github.io/ggdibbler/in...
You can now pass random variables to any aesthetic in any ggplot geom/stat. If you can express it as a distribution, ggdibbler can plot it. It also works with ggplot extensions, like gganimate. #rstats
harriet-mason.github.io/ggdibbler/in...
You can now pass random variables to any aesthetic in any ggplot geom/stat. If you can express it as a distribution, ggdibbler can plot it. It also works with ggplot extensions, like gganimate. #rstats
Reposted by Nicola Rennie

Reposted by Nicola Rennie
Spotify has laid off thousands in recent years, while reportedly paying artists $0.003 per stream.
Spotify profits rose 28% in Q3. Its CEO is worth $9.8 billion. It's making money off ICE recruitment ads.
Don't you think it's time put a wrap on corporate greed and exploitation?
Spotify profits rose 28% in Q3. Its CEO is worth $9.8 billion. It's making money off ICE recruitment ads.
Don't you think it's time put a wrap on corporate greed and exploitation?
December 4, 2025 at 5:10 PM
Spotify has laid off thousands in recent years, while reportedly paying artists $0.003 per stream.
Spotify profits rose 28% in Q3. Its CEO is worth $9.8 billion. It's making money off ICE recruitment ads.
Don't you think it's time put a wrap on corporate greed and exploitation?
Spotify profits rose 28% in Q3. Its CEO is worth $9.8 billion. It's making money off ICE recruitment ads.
Don't you think it's time put a wrap on corporate greed and exploitation?
Reposted by Nicola Rennie

R Weekly 2025-W49 Custom GPS, testing, Tribal Councils
https://rweekly.org/2025-W49.html
#rstats #datascience
https://rweekly.org/2025-W49.html
#rstats #datascience

R Weekly 2025-W49 Custom GPS, testing, Tribal Councils
Summary: Custom GPS routing in R, testing with testthat, and community insights from R Weekly 2025-W49
rweekly.org
December 1, 2025 at 9:04 PM
R Weekly 2025-W49 Custom GPS, testing, Tribal Councils
https://rweekly.org/2025-W49.html
#rstats #datascience
https://rweekly.org/2025-W49.html
#rstats #datascience
Reposted by Nicola Rennie

We just published our “Top of the Charts”, a look at our most popular charts, articles, data insights & more in 2025! (link in 🧵)
Here are our top 5 most-viewed charts.
Each Friday over the next few weeks, we’ll share the top 5 for other categories (articles, etc.). Stay tuned!
1. CO2 emissions
Here are our top 5 most-viewed charts.
Each Friday over the next few weeks, we’ll share the top 5 for other categories (articles, etc.). Stay tuned!
1. CO2 emissions

December 5, 2025 at 10:19 AM
We just published our “Top of the Charts”, a look at our most popular charts, articles, data insights & more in 2025! (link in 🧵)
Here are our top 5 most-viewed charts.
Each Friday over the next few weeks, we’ll share the top 5 for other categories (articles, etc.). Stay tuned!
1. CO2 emissions
Here are our top 5 most-viewed charts.
Each Friday over the next few weeks, we’ll share the top 5 for other categories (articles, etc.). Stay tuned!
1. CO2 emissions