


Michael Friendly
@datavisfriendly.bsky.social
ASA Fellow; #rstats developer of graphical methods for categorical and multivariate data; #datavis history of data visualization; #historicaldatavis; Milestones project
Web: www.datavis.ca
GitHub: github.com/friendly
Web: www.datavis.ca
GitHub: github.com/friendly
Pinned

There's a delicious time in book writing when I switch from actual writing & making graphs to POLISHING-- smoothing language, adding X-references, and improving graphs that don't pass the smell test.
I'm there now with my book, Visualizing Multivariate Data and Models with R.
What a sweet feeling!
I'm there now with my book, Visualizing Multivariate Data and Models with R.
What a sweet feeling!
Great collection! The fact that the graphics are a bit clunky, retro-style makes them more charming.

I'll always donate part of my day to a good optical illusion, so here are a whole bunch of them:
optical.toys
optical.toys
Optical Toys | Optical Illusions and Toys
A collection of optical illusions and optical toys by Toms Toys
optical.toys
November 30, 2025 at 2:35 AM
Great collection! The fact that the graphics are a bit clunky, retro-style makes them more charming.
#TodayinHistory #dataviz #OTD 📊
💀Nov 28, 1680 Athanasius Kirscher died in Rome, Italy 🇮🇹
1646: Invention of the first projection lantern (the magic lantern) described
in in his Ars Magna Lucis et Umbrae
See: www.jstor.org/stable/43424... for the story
💀Nov 28, 1680 Athanasius Kirscher died in Rome, Italy 🇮🇹
1646: Invention of the first projection lantern (the magic lantern) described
in in his Ars Magna Lucis et Umbrae
See: www.jstor.org/stable/43424... for the story
ATHANASIUS KIRCHER AND THE MAGIC LANTERN on JSTOR
R. A. HOUSTOUN, ATHANASIUS KIRCHER AND THE MAGIC LANTERN, Science Progress (1933-), Vol. 45, No. 179 (JULY, 1957), pp. 462-464
www.jstor.org
November 30, 2025 at 2:24 AM
#TodayinHistory #dataviz #OTD 📊
💀Nov 28, 1680 Athanasius Kirscher died in Rome, Italy 🇮🇹
1646: Invention of the first projection lantern (the magic lantern) described
in in his Ars Magna Lucis et Umbrae
See: www.jstor.org/stable/43424... for the story
💀Nov 28, 1680 Athanasius Kirscher died in Rome, Italy 🇮🇹
1646: Invention of the first projection lantern (the magic lantern) described
in in his Ars Magna Lucis et Umbrae
See: www.jstor.org/stable/43424... for the story
Reposted by Michael Friendly

I remember John Fox as one of the most kind R Foundation #rstats members (ca. 2006-2023) giving wise and kind words often. The 1-1 interview he held with several of us, resulting in a useR!2008 pres and the article journal.r-project.org/articles/RJ-... It is sad to miss him. May he rest in peace!
#rstats
It is with profound sadness I heard that my long-time friend and colleague, John Fox passed away this week.
He was the author of {car}, {effects}, {Rcmdr}, ... and numerous influential books. I will miss him greatly.
www.john-fox.ca
It is with profound sadness I heard that my long-time friend and colleague, John Fox passed away this week.
He was the author of {car}, {effects}, {Rcmdr}, ... and numerous influential books. I will miss him greatly.
www.john-fox.ca
John Fox: Books and Software
www.john-fox.ca
November 28, 2025 at 8:57 PM
I remember John Fox as one of the most kind R Foundation #rstats members (ca. 2006-2023) giving wise and kind words often. The 1-1 interview he held with several of us, resulting in a useR!2008 pres and the article journal.r-project.org/articles/RJ-... It is sad to miss him. May he rest in peace!
#TodayinHistory #dataviz #OTD 📊
🎂Nov 28, 1772 Luke Howard born in London, England 🏴
Who invented graph paper?
1800: Use of coordinate paper in published research (automatic recording; graph of barometric variations)
🎂Nov 28, 1772 Luke Howard born in London, England 🏴
Who invented graph paper?
1800: Use of coordinate paper in published research (automatic recording; graph of barometric variations)


November 29, 2025 at 2:28 AM
#TodayinHistory #dataviz #OTD 📊
🎂Nov 28, 1772 Luke Howard born in London, England 🏴
Who invented graph paper?
1800: Use of coordinate paper in published research (automatic recording; graph of barometric variations)
🎂Nov 28, 1772 Luke Howard born in London, England 🏴
Who invented graph paper?
1800: Use of coordinate paper in published research (automatic recording; graph of barometric variations)
#rstats
It is with profound sadness I heard that my long-time friend and colleague, John Fox passed away this week.
He was the author of {car}, {effects}, {Rcmdr}, ... and numerous influential books. I will miss him greatly.
www.john-fox.ca
It is with profound sadness I heard that my long-time friend and colleague, John Fox passed away this week.
He was the author of {car}, {effects}, {Rcmdr}, ... and numerous influential books. I will miss him greatly.
www.john-fox.ca
John Fox: Books and Software
www.john-fox.ca
November 28, 2025 at 3:26 PM
#rstats
It is with profound sadness I heard that my long-time friend and colleague, John Fox passed away this week.
He was the author of {car}, {effects}, {Rcmdr}, ... and numerous influential books. I will miss him greatly.
www.john-fox.ca
It is with profound sadness I heard that my long-time friend and colleague, John Fox passed away this week.
He was the author of {car}, {effects}, {Rcmdr}, ... and numerous influential books. I will miss him greatly.
www.john-fox.ca
Reposted by Michael Friendly
New CRAN package colorize with initial version 0.2.1
#rstats
https://cran.r-project.org/package=colorize
#rstats
https://cran.r-project.org/package=colorize

CRAN: Package colorize
Provides some simple functions for printing text in color in 'markdown' or 'Quarto' documents, to be rendered as HTML or LaTeX. This is useful when writing about the use of colors in graphs or tables, where you want to print their names in their actual color to give a direct impression of the color, like “red” shown in red, or “blue” shown in blue.
cran.r-project.org
November 27, 2025 at 8:02 PM
New CRAN package colorize with initial version 0.2.1
#rstats
https://cran.r-project.org/package=colorize
#rstats
https://cran.r-project.org/package=colorize
#TodayinHistory #dataviz #OTD 📊
💀Nov 27, 1959 Willard Cope Brinton died in New York, USA 🇺🇸
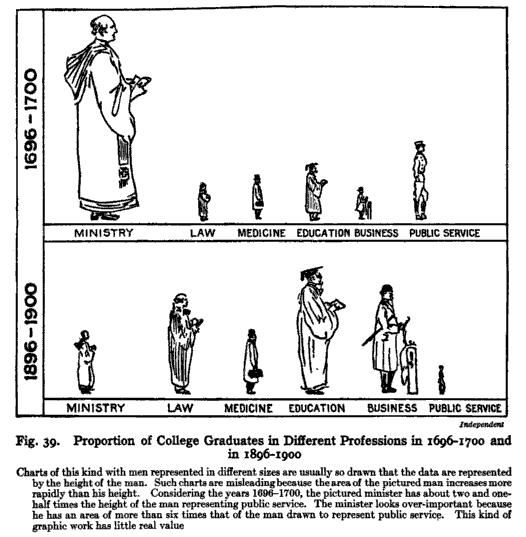
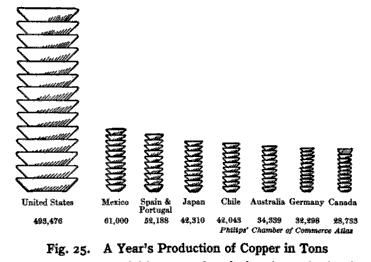
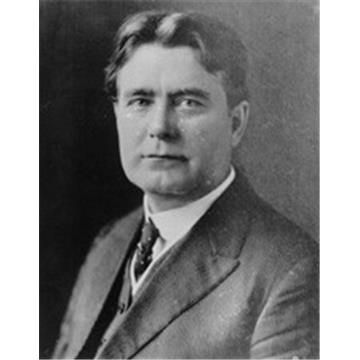
1914: Pictograms to represent a series of numbers by icons (combining concepts of the bar graph and pictogram of varying size), but commits some graphical sins.
💀Nov 27, 1959 Willard Cope Brinton died in New York, USA 🇺🇸
1914: Pictograms to represent a series of numbers by icons (combining concepts of the bar graph and pictogram of varying size), but commits some graphical sins.
November 28, 2025 at 3:08 AM
#TodayinHistory #dataviz #OTD 📊
💀Nov 27, 1959 Willard Cope Brinton died in New York, USA 🇺🇸
1914: Pictograms to represent a series of numbers by icons (combining concepts of the bar graph and pictogram of varying size), but commits some graphical sins.
💀Nov 27, 1959 Willard Cope Brinton died in New York, USA 🇺🇸
1914: Pictograms to represent a series of numbers by icons (combining concepts of the bar graph and pictogram of varying size), but commits some graphical sins.
#TodayinHistory #dataviz #OTD 📊
💀Nov 27, 1754 Abraham de Moivre died in London, England 🏴
1733: The normal distribution, derived as the limit of the binomial distribution (in The Doctrine of Chances)
💀Nov 27, 1754 Abraham de Moivre died in London, England 🏴
1733: The normal distribution, derived as the limit of the binomial distribution (in The Doctrine of Chances)


November 28, 2025 at 2:23 AM
#TodayinHistory #dataviz #OTD 📊
💀Nov 27, 1754 Abraham de Moivre died in London, England 🏴
1733: The normal distribution, derived as the limit of the binomial distribution (in The Doctrine of Chances)
💀Nov 27, 1754 Abraham de Moivre died in London, England 🏴
1733: The normal distribution, derived as the limit of the binomial distribution (in The Doctrine of Chances)
#TodayinHistory #dataviz #OTD 📊
🎂Nov 27, 1942 Stephen E. Fienberg born in Toronto, ON, Canada 🇨🇦
A giant in statistical science in many areas-- loglinear models,
public policy, census, forensics, Bayesian methods, ...
He is remembered in this memorial volume: bit.ly/47UFtTJ
🎂Nov 27, 1942 Stephen E. Fienberg born in Toronto, ON, Canada 🇨🇦
A giant in statistical science in many areas-- loglinear models,
public policy, census, forensics, Bayesian methods, ...
He is remembered in this memorial volume: bit.ly/47UFtTJ
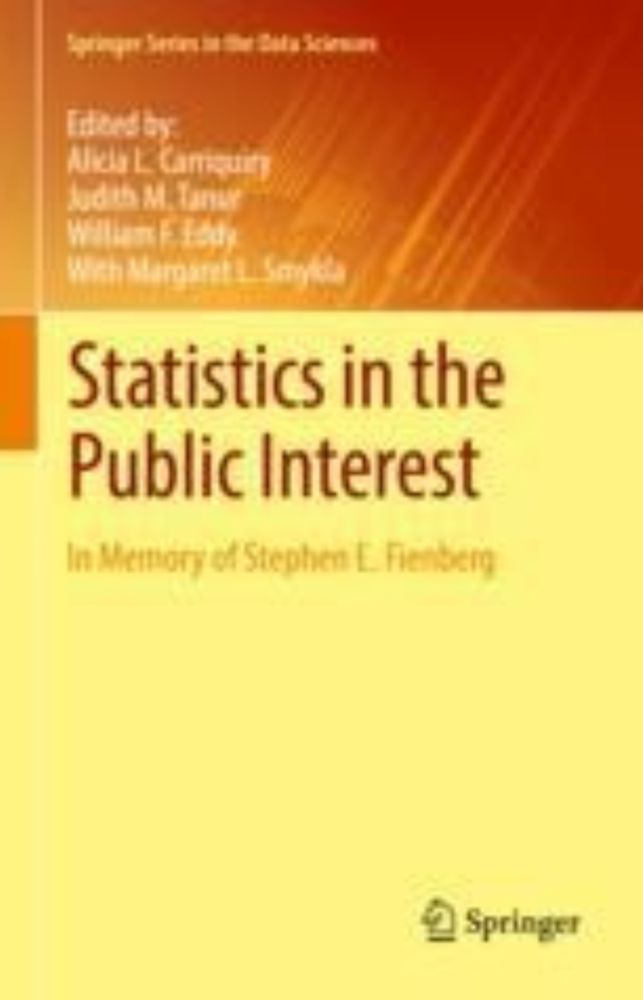
Statistics in the Public Interest
This book surveys a variety of topics in statistics and the social sciences in memory of the late Stephen Fienberg.
bit.ly
November 28, 2025 at 2:10 AM
#TodayinHistory #dataviz #OTD 📊
🎂Nov 27, 1942 Stephen E. Fienberg born in Toronto, ON, Canada 🇨🇦
A giant in statistical science in many areas-- loglinear models,
public policy, census, forensics, Bayesian methods, ...
He is remembered in this memorial volume: bit.ly/47UFtTJ
🎂Nov 27, 1942 Stephen E. Fienberg born in Toronto, ON, Canada 🇨🇦
A giant in statistical science in many areas-- loglinear models,
public policy, census, forensics, Bayesian methods, ...
He is remembered in this memorial volume: bit.ly/47UFtTJ
The {colorize} 📦 now on CRAN
github.com/friendly/col...
github.com/friendly/col...
November 28, 2025 at 2:09 AM
The {colorize} 📦 now on CRAN
github.com/friendly/col...
github.com/friendly/col...
#map #memes
"Map of Online Communities and Related Points of Interest" from Spring 2007 according to Randall Munroe @xkcd-titletext.bsky.social
I found this in a presentation I gave that year, and had another good chuckle
Who remembers AOL? Windows Live?
Have a nice vacation in the Blogipelago
"Map of Online Communities and Related Points of Interest" from Spring 2007 according to Randall Munroe @xkcd-titletext.bsky.social
I found this in a presentation I gave that year, and had another good chuckle
Who remembers AOL? Windows Live?
Have a nice vacation in the Blogipelago

November 28, 2025 at 1:36 AM
#map #memes
"Map of Online Communities and Related Points of Interest" from Spring 2007 according to Randall Munroe @xkcd-titletext.bsky.social
I found this in a presentation I gave that year, and had another good chuckle
Who remembers AOL? Windows Live?
Have a nice vacation in the Blogipelago
"Map of Online Communities and Related Points of Interest" from Spring 2007 according to Randall Munroe @xkcd-titletext.bsky.social
I found this in a presentation I gave that year, and had another good chuckle
Who remembers AOL? Windows Live?
Have a nice vacation in the Blogipelago
Lots of eye candy here!

One of the things that has been on my to do list for a very long time, is building a gallery of all of the charts I've made across #TidyTuesday, #30DayChartChallenge, #30DayMapChallenge, and other miscellaneous projects 📊
And it's finally here!
Link: nrennie.rbind.io/viz-gallery/
#DataViz #RStats
And it's finally here!
Link: nrennie.rbind.io/viz-gallery/
#DataViz #RStats
November 27, 2025 at 3:41 AM
Lots of eye candy here!


#TodayinHistory #dataviz #OTD 📊
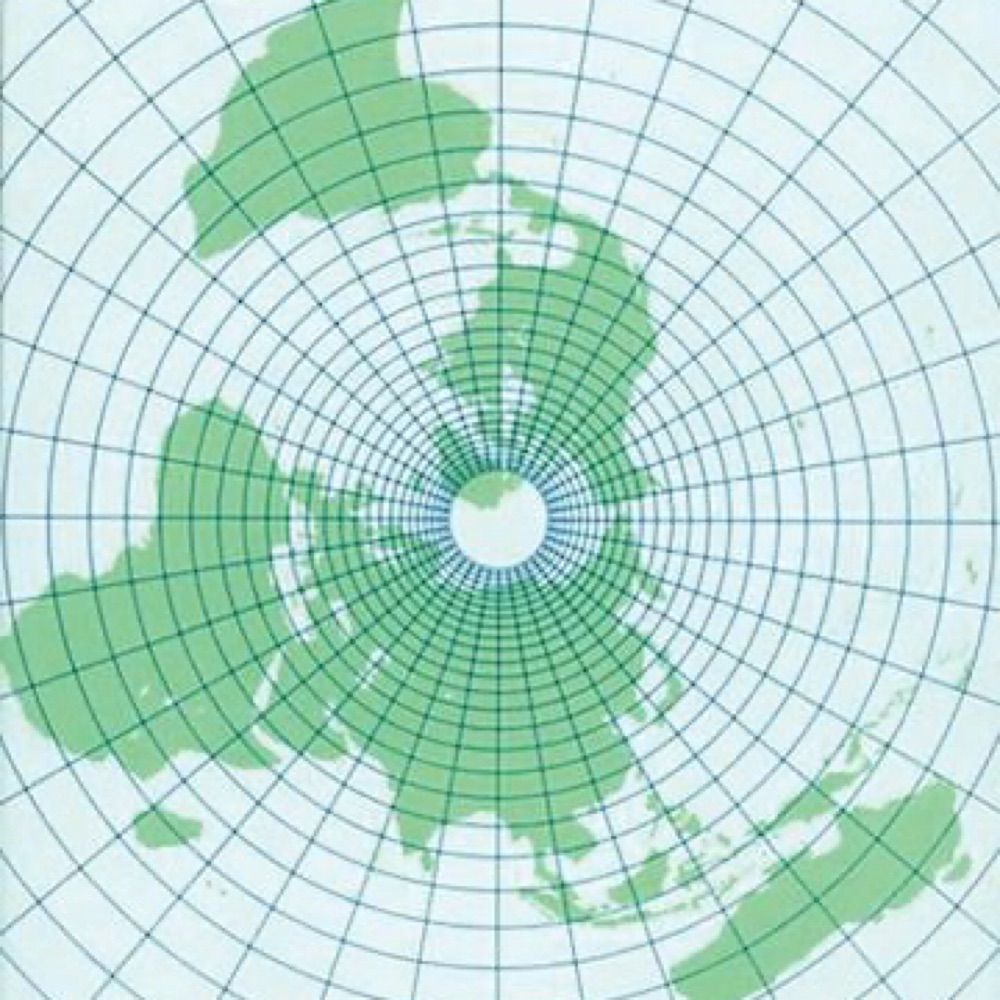
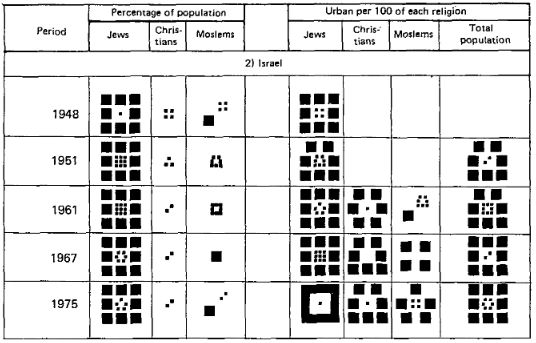
💀Nov 26, 1995 Roberto Bachi died in Jerusalem, Israel 🇮🇱
1968: Systematic "graphical rational patterns'' for statistical presentation
Schemes for representing numbers by icons, visual weight ~ number
💀Nov 26, 1995 Roberto Bachi died in Jerusalem, Israel 🇮🇱
1968: Systematic "graphical rational patterns'' for statistical presentation
Schemes for representing numbers by icons, visual weight ~ number


November 27, 2025 at 1:39 AM
#TodayinHistory #dataviz #OTD 📊
💀Nov 26, 1995 Roberto Bachi died in Jerusalem, Israel 🇮🇱
1968: Systematic "graphical rational patterns'' for statistical presentation
Schemes for representing numbers by icons, visual weight ~ number
💀Nov 26, 1995 Roberto Bachi died in Jerusalem, Israel 🇮🇱
1968: Systematic "graphical rational patterns'' for statistical presentation
Schemes for representing numbers by icons, visual weight ~ number
#TodayinHistory #dataviz #OTD 📊
📅Nov 25, 1731 Leonhard Euler first used the symbol _e_ to denote the base of natural logs 2.71728... in a letter to Christian Goldbach.
(Published it first in a 1728 paper.)
Why e? See: bit.ly/4pBYweE
📅Nov 25, 1731 Leonhard Euler first used the symbol _e_ to denote the base of natural logs 2.71728... in a letter to Christian Goldbach.
(Published it first in a 1728 paper.)
Why e? See: bit.ly/4pBYweE

Why was $\rm e$ named $\rm e$? What is the history and rationale behind it?
Why does the constant that Euler discovered have the symbol $\rm e$ and not other symbols? What is the history and rationale behind it?
bit.ly
November 26, 2025 at 3:17 PM
#TodayinHistory #dataviz #OTD 📊
📅Nov 25, 1731 Leonhard Euler first used the symbol _e_ to denote the base of natural logs 2.71728... in a letter to Christian Goldbach.
(Published it first in a 1728 paper.)
Why e? See: bit.ly/4pBYweE
📅Nov 25, 1731 Leonhard Euler first used the symbol _e_ to denote the base of natural logs 2.71728... in a letter to Christian Goldbach.
(Published it first in a 1728 paper.)
Why e? See: bit.ly/4pBYweE
#TodayinHistory #dataviz #OTD 📊
💀Nov 23, 1694 Jean Talon died in Chalons-en-Champagne, France 🇫🇷
1666: First modern complete demographic #census, a record of each individual by name of the 3215 inhabitants of New France (now CA 🇨🇦)
[Data collected on 🐎back]
👀🔗 bit.ly/3U0XQyY
💀Nov 23, 1694 Jean Talon died in Chalons-en-Champagne, France 🇫🇷
1666: First modern complete demographic #census, a record of each individual by name of the 3215 inhabitants of New France (now CA 🇨🇦)
[Data collected on 🐎back]
👀🔗 bit.ly/3U0XQyY
bit.ly
November 25, 2025 at 3:41 AM
#TodayinHistory #dataviz #OTD 📊
💀Nov 23, 1694 Jean Talon died in Chalons-en-Champagne, France 🇫🇷
1666: First modern complete demographic #census, a record of each individual by name of the 3215 inhabitants of New France (now CA 🇨🇦)
[Data collected on 🐎back]
👀🔗 bit.ly/3U0XQyY
💀Nov 23, 1694 Jean Talon died in Chalons-en-Champagne, France 🇫🇷
1666: First modern complete demographic #census, a record of each individual by name of the 3215 inhabitants of New France (now CA 🇨🇦)
[Data collected on 🐎back]
👀🔗 bit.ly/3U0XQyY
#TodayinHistory #dataviz #OTD 📊
💀Nov 23, 1919 Henry Laurence Gantt died in Pine Island, NY, USA 🇺🇸
1917: Invented the Gantt chart, designed to show scheduled and actual progress of projects
💀Nov 23, 1919 Henry Laurence Gantt died in Pine Island, NY, USA 🇺🇸
1917: Invented the Gantt chart, designed to show scheduled and actual progress of projects


November 25, 2025 at 3:32 AM
#TodayinHistory #dataviz #OTD 📊
💀Nov 23, 1919 Henry Laurence Gantt died in Pine Island, NY, USA 🇺🇸
1917: Invented the Gantt chart, designed to show scheduled and actual progress of projects
💀Nov 23, 1919 Henry Laurence Gantt died in Pine Island, NY, USA 🇺🇸
1917: Invented the Gantt chart, designed to show scheduled and actual progress of projects
Careful here. You should wear gloves to touch the graphs it produces

November 25, 2025 at 3:14 AM
Careful here. You should wear gloves to touch the graphs it produces
Reposted by Michael Friendly

We are putting together the next interview with Michael Friendly @datavisfriendly.bsky.social I can tell you, that it will be a tour de force about the history of dataviz. Coming soon! Until then you can read the first in the series with RJ Andrews @infowetrust.com.

Moving past superficial histories: interview with RJ Andrews
The Curious Cabinet #1.
attilabatorfy.substack.com
November 24, 2025 at 7:04 PM
We are putting together the next interview with Michael Friendly @datavisfriendly.bsky.social I can tell you, that it will be a tour de force about the history of dataviz. Coming soon! Until then you can read the first in the series with RJ Andrews @infowetrust.com.
#TodayinHistory #dataviz #OTD 📊
💀Nov 23, 1916 Charles Booth died in Thringstone, Leicestershire, England 🏴
1889: Social mapping. Street maps of London, showing poverty and wealth by color coding--> transforming existing methods of social survey and poverty mapping towards the end of the 19th C
💀Nov 23, 1916 Charles Booth died in Thringstone, Leicestershire, England 🏴
1889: Social mapping. Street maps of London, showing poverty and wealth by color coding--> transforming existing methods of social survey and poverty mapping towards the end of the 19th C


November 25, 2025 at 2:44 AM
#TodayinHistory #dataviz #OTD 📊
💀Nov 23, 1916 Charles Booth died in Thringstone, Leicestershire, England 🏴
1889: Social mapping. Street maps of London, showing poverty and wealth by color coding--> transforming existing methods of social survey and poverty mapping towards the end of the 19th C
💀Nov 23, 1916 Charles Booth died in Thringstone, Leicestershire, England 🏴
1889: Social mapping. Street maps of London, showing poverty and wealth by color coding--> transforming existing methods of social survey and poverty mapping towards the end of the 19th C
#TodayinHistory #dataviz #OTD 📊
🎂Nov 23, 1887 Henry Gwyn Jeffreys Moseley born in Weymouth, England 🏴
1913: Discovery of the concept of atomic number, based largely on graphical analysis. Even predicted new elements!
Nobel prize worthy, except he died in WWI
🎂Nov 23, 1887 Henry Gwyn Jeffreys Moseley born in Weymouth, England 🏴
1913: Discovery of the concept of atomic number, based largely on graphical analysis. Even predicted new elements!
Nobel prize worthy, except he died in WWI


November 25, 2025 at 2:31 AM
#TodayinHistory #dataviz #OTD 📊
🎂Nov 23, 1887 Henry Gwyn Jeffreys Moseley born in Weymouth, England 🏴
1913: Discovery of the concept of atomic number, based largely on graphical analysis. Even predicted new elements!
Nobel prize worthy, except he died in WWI
🎂Nov 23, 1887 Henry Gwyn Jeffreys Moseley born in Weymouth, England 🏴
1913: Discovery of the concept of atomic number, based largely on graphical analysis. Even predicted new elements!
Nobel prize worthy, except he died in WWI
Filled my bird feeder and it took ~5 days for them to get the message, but I wonder how they ALL know. I guess they 🐥 tweet 🐥
November 24, 2025 at 8:42 PM
Filled my bird feeder and it took ~5 days for them to get the message, but I wonder how they ALL know. I guess they 🐥 tweet 🐥
#rstats Using Rhub: Every time I do `devtools::release()` for a package, it asks if I've checked with Rhub. I always lie, because it was painful and confusing.
Now, I'm prompted to look at `?rhub::rhubv2` but the doc is more like a vignette, and doesn't really tell me how to get started simply.
Now, I'm prompted to look at `?rhub::rhubv2` but the doc is more like a vignette, and doesn't really tell me how to get started simply.
November 24, 2025 at 8:28 PM
#rstats Using Rhub: Every time I do `devtools::release()` for a package, it asks if I've checked with Rhub. I always lie, because it was painful and confusing.
Now, I'm prompted to look at `?rhub::rhubv2` but the doc is more like a vignette, and doesn't really tell me how to get started simply.
Now, I'm prompted to look at `?rhub::rhubv2` but the doc is more like a vignette, and doesn't really tell me how to get started simply.
@attilabatorfy.bsky.social delights #dataviz with:
Pie chart frenzy from Brazil
open.substack.com/pub/attilaba...
Pie chart frenzy from Brazil
open.substack.com/pub/attilaba...

Pie chart frenzy from Brazil
The illustrations of the "Little Atlas of Coffee" from the early 1940s.
open.substack.com
November 24, 2025 at 2:48 PM
@attilabatorfy.bsky.social delights #dataviz with:
Pie chart frenzy from Brazil
open.substack.com/pub/attilaba...
Pie chart frenzy from Brazil
open.substack.com/pub/attilaba...