


Darakhshan Nehal
@darakhshann.bsky.social
Health Data Science | 📊 DataViz | 📖✨️ | 🐾
Looking for health data analytics or data science position.
LinkedIn: www.linkedin.com/in/darakhshan-nehal-b38747154/
GitHub: https://github.com/darakhshannehal
Looking for health data analytics or data science position.
LinkedIn: www.linkedin.com/in/darakhshan-nehal-b38747154/
GitHub: https://github.com/darakhshannehal
Pinned
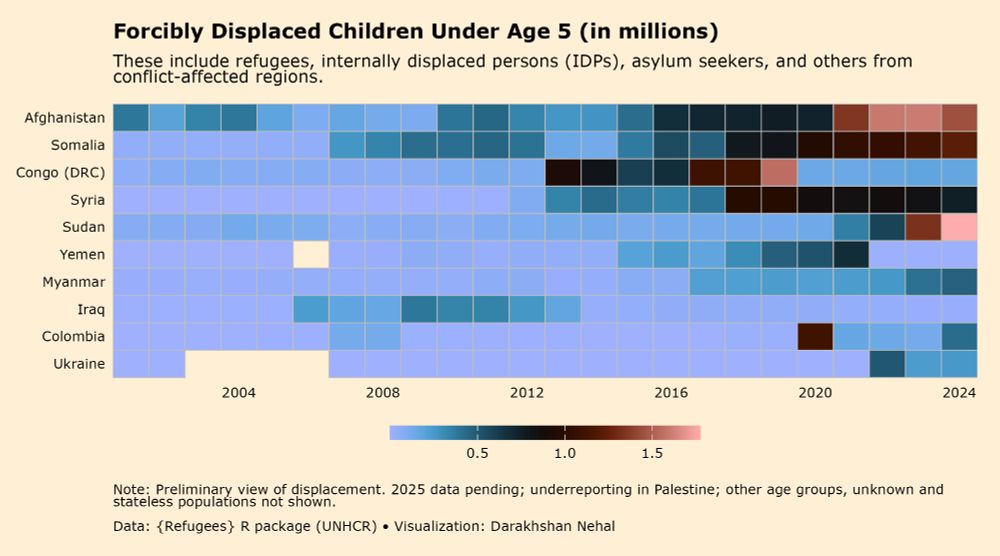
Visualizing displacement | {refugees} R package, @unhcr.org
I created a heatmap that highlights trends in forced displacement in children across selected countries.
Feedback is appreciated!
Code: github.com/darakhshanne...
#RStats #DataViz #ggplot2
I created a heatmap that highlights trends in forced displacement in children across selected countries.
Feedback is appreciated!
Code: github.com/darakhshanne...
#RStats #DataViz #ggplot2
Reposted by Darakhshan Nehal

Today's humanitarian update:
➖ #Gaza: Heavy rains put displaced communities at risk
➖ #Sudan: @tomfletcherun.bsky.social warns needs outpace resources to support North Darfur displaced
➖ #Ukraine: Large-scale attacks kill, injure dozens of civilians
➡️ bit.ly/4iieIiC
➖ #Gaza: Heavy rains put displaced communities at risk
➖ #Sudan: @tomfletcherun.bsky.social warns needs outpace resources to support North Darfur displaced
➖ #Ukraine: Large-scale attacks kill, injure dozens of civilians
➡️ bit.ly/4iieIiC
November 25, 2025 at 9:49 PM
Today's humanitarian update:
➖ #Gaza: Heavy rains put displaced communities at risk
➖ #Sudan: @tomfletcherun.bsky.social warns needs outpace resources to support North Darfur displaced
➖ #Ukraine: Large-scale attacks kill, injure dozens of civilians
➡️ bit.ly/4iieIiC
➖ #Gaza: Heavy rains put displaced communities at risk
➖ #Sudan: @tomfletcherun.bsky.social warns needs outpace resources to support North Darfur displaced
➖ #Ukraine: Large-scale attacks kill, injure dozens of civilians
➡️ bit.ly/4iieIiC
Reposted by Darakhshan Nehal

At least in Rmd/qmd, if you see output you have a sense it was run in a certain order. With Jupyter notebook output not even god knows the execution order
November 25, 2025 at 4:19 PM
At least in Rmd/qmd, if you see output you have a sense it was run in a certain order. With Jupyter notebook output not even god knows the execution order
Reposted by Darakhshan Nehal

#30DayMapChallenge Day 25: Hexagons. Since people like to associate hexagons with bees, here is a map showing diversity of bee species in the #GulfofMexico region Data via CNN.

November 25, 2025 at 2:16 PM
#30DayMapChallenge Day 25: Hexagons. Since people like to associate hexagons with bees, here is a map showing diversity of bee species in the #GulfofMexico region Data via CNN.
Reposted by Darakhshan Nehal

November 10, 2025 at 7:57 PM
Reposted by Darakhshan Nehal

Local woman went out and got something stupid for the cats


November 24, 2025 at 6:53 PM
Local woman went out and got something stupid for the cats
Reposted by Darakhshan Nehal

"The 'ceasefire' is a diplomatic sham – a cover for the continuing extermination, displacement and erasure of the Palestinian people in Gaza and a distraction for the international public and the media."
— #AJOpinion by @yarahawari.bsky.social ⤵️ aje.io/p14911
— #AJOpinion by @yarahawari.bsky.social ⤵️ aje.io/p14911

No, there is no ceasefire in Gaza
Israel’s bombing of Gaza is not a ‘violation of the ceasefire'. It is a continuing genocide under diplomatic cover.
aje.io
November 24, 2025 at 10:38 AM
"The 'ceasefire' is a diplomatic sham – a cover for the continuing extermination, displacement and erasure of the Palestinian people in Gaza and a distraction for the international public and the media."
— #AJOpinion by @yarahawari.bsky.social ⤵️ aje.io/p14911
— #AJOpinion by @yarahawari.bsky.social ⤵️ aje.io/p14911
Reposted by Darakhshan Nehal
More than 9,500 Palestinians remain missing as search efforts continue amid the widespread destruction caused by Israel's genocidal war on Gaza, according to estimates by Gaza's Government Media Office.
#Infograph
#Infograph

November 24, 2025 at 1:26 PM
More than 9,500 Palestinians remain missing as search efforts continue amid the widespread destruction caused by Israel's genocidal war on Gaza, according to estimates by Gaza's Government Media Office.
#Infograph
#Infograph
Reposted by Darakhshan Nehal

My paper "Examining the Interface Design of Tidyverse" is now published in ANZJS. This paper calls attention to the importance of UI/UX principles & approaches to statisiticians and #rstats developers.
Many thanks to reviewers who made this paper better!
🔗 onlinelibrary.wiley.com/share/author...
Many thanks to reviewers who made this paper better!
🔗 onlinelibrary.wiley.com/share/author...

November 23, 2025 at 9:58 AM
My paper "Examining the Interface Design of Tidyverse" is now published in ANZJS. This paper calls attention to the importance of UI/UX principles & approaches to statisiticians and #rstats developers.
Many thanks to reviewers who made this paper better!
🔗 onlinelibrary.wiley.com/share/author...
Many thanks to reviewers who made this paper better!
🔗 onlinelibrary.wiley.com/share/author...
Reposted by Darakhshan Nehal

Reposted by Darakhshan Nehal

This week on What's New in R, we're featuring:
✅ A dive into {ggplot2}’s geoms and stats by @mattansb.msbstats.info
✅ New book on spatial data viz. by @jakubnowosad.com & Martijn Tennekes
✅ Demo of AI features in Positron by @ryjohnson09.bsky.social
Read the issue: buff.ly/bA4ar3v
#rstats
✅ A dive into {ggplot2}’s geoms and stats by @mattansb.msbstats.info
✅ New book on spatial data viz. by @jakubnowosad.com & Martijn Tennekes
✅ Demo of AI features in Positron by @ryjohnson09.bsky.social
Read the issue: buff.ly/bA4ar3v
#rstats


November 24, 2025 at 3:04 PM
This week on What's New in R, we're featuring:
✅ A dive into {ggplot2}’s geoms and stats by @mattansb.msbstats.info
✅ New book on spatial data viz. by @jakubnowosad.com & Martijn Tennekes
✅ Demo of AI features in Positron by @ryjohnson09.bsky.social
Read the issue: buff.ly/bA4ar3v
#rstats
✅ A dive into {ggplot2}’s geoms and stats by @mattansb.msbstats.info
✅ New book on spatial data viz. by @jakubnowosad.com & Martijn Tennekes
✅ Demo of AI features in Positron by @ryjohnson09.bsky.social
Read the issue: buff.ly/bA4ar3v
#rstats
Reposted by Darakhshan Nehal

🗺️ Back with another map-making blog post! 🗺️
Learn how to make your own custom GPS route map entirely in #RStats 📊 Perfect timing whether you're looking for a #30DayMapChallenge idea, or planning a Christmas gift for your running friend 🎅
Link in comments 👇👇
#ggplot2 #DataViz #RSpatial
Learn how to make your own custom GPS route map entirely in #RStats 📊 Perfect timing whether you're looking for a #30DayMapChallenge idea, or planning a Christmas gift for your running friend 🎅
Link in comments 👇👇
#ggplot2 #DataViz #RSpatial

November 24, 2025 at 5:34 PM
🗺️ Back with another map-making blog post! 🗺️
Learn how to make your own custom GPS route map entirely in #RStats 📊 Perfect timing whether you're looking for a #30DayMapChallenge idea, or planning a Christmas gift for your running friend 🎅
Link in comments 👇👇
#ggplot2 #DataViz #RSpatial
Learn how to make your own custom GPS route map entirely in #RStats 📊 Perfect timing whether you're looking for a #30DayMapChallenge idea, or planning a Christmas gift for your running friend 🎅
Link in comments 👇👇
#ggplot2 #DataViz #RSpatial
Reposted by Darakhshan Nehal

If you want your work to be reproducible, you have to remember that others don't have the insider knowledge you have. You have to be explicit.
This morning I was able to recreate a file made by someone else because they explicitly documented their definitions, calculations, and their assumptions. 🫶
This morning I was able to recreate a file made by someone else because they explicitly documented their definitions, calculations, and their assumptions. 🫶
November 24, 2025 at 2:09 PM
If you want your work to be reproducible, you have to remember that others don't have the insider knowledge you have. You have to be explicit.
This morning I was able to recreate a file made by someone else because they explicitly documented their definitions, calculations, and their assumptions. 🫶
This morning I was able to recreate a file made by someone else because they explicitly documented their definitions, calculations, and their assumptions. 🫶
Reposted by Darakhshan Nehal


Reposted by Darakhshan Nehal

In case you can't access the original article in full: archive.is/M2wK8
"Multiple men have remained in senior roles at Oxford for months or years after allegations of sexual misconduct emerged against them, Bloomberg found in a nine-month investigation based on interviews with almost 50 people as well as documents and other records."

Oxford University Has Failed Women Over Harassment Concerns, Staff Say
The university has repeatedly been slow to act against male academics accused of sexual misconduct and inappropriate behavior, a Bloomberg investigation found.
www.bloomberg.com
November 20, 2025 at 10:53 AM
In case you can't access the original article in full: archive.is/M2wK8
Reposted by Darakhshan Nehal

"Multiple men have remained in senior roles at Oxford for months or years after allegations of sexual misconduct emerged against them, Bloomberg found in a nine-month investigation based on interviews with almost 50 people as well as documents and other records."
Oxford University Has Failed Women Over Harassment Concerns, Staff Say
The university has repeatedly been slow to act against male academics accused of sexual misconduct and inappropriate behavior, a Bloomberg investigation found.
www.bloomberg.com
November 19, 2025 at 9:56 PM
"Multiple men have remained in senior roles at Oxford for months or years after allegations of sexual misconduct emerged against them, Bloomberg found in a nine-month investigation based on interviews with almost 50 people as well as documents and other records."
Reposted by Darakhshan Nehal

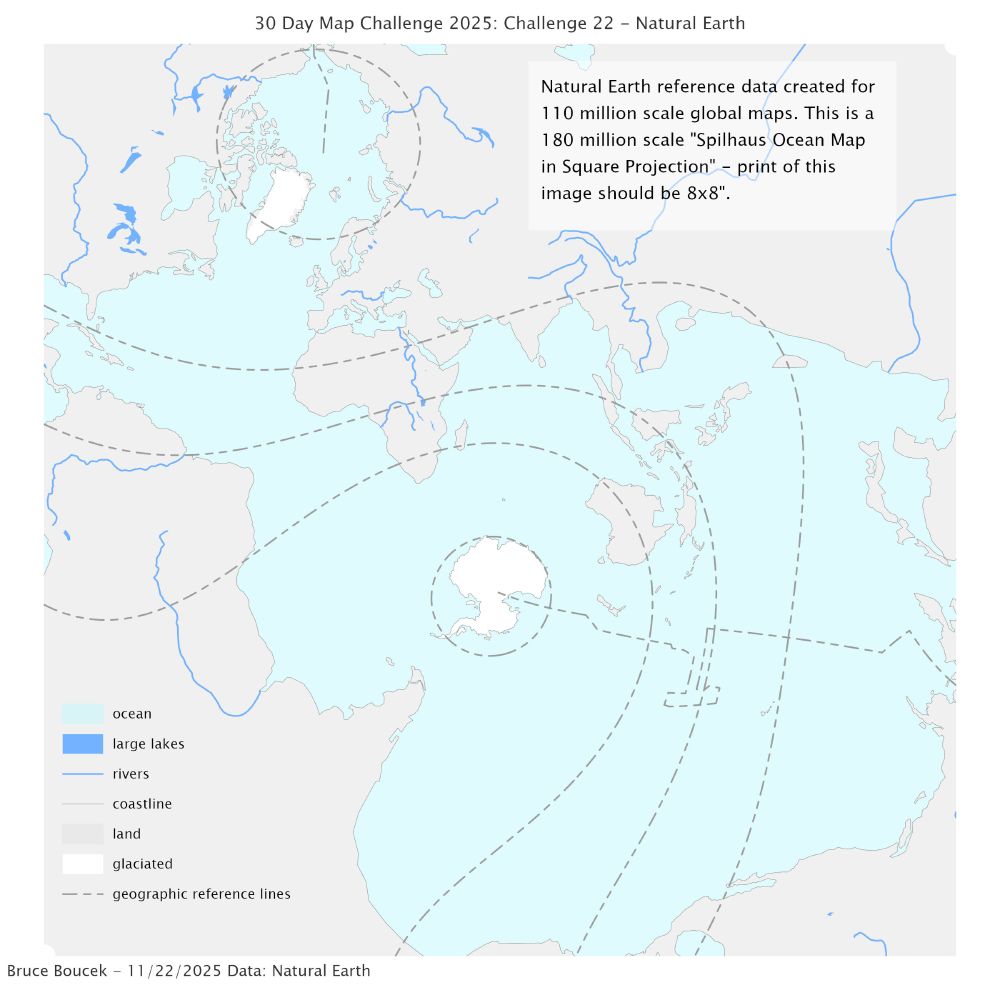
30 Day Map Challenge
Day 22: Natural Earth
#30daymapchallenge #30daymapchallenge2025
Natural Earth Data is created for world and regional maps at optimal scales. This map uses 110m scale Natural Earth data on an unusual projection - the Spilhaus Ocean Map in Square Projection.
Day 22: Natural Earth
#30daymapchallenge #30daymapchallenge2025
Natural Earth Data is created for world and regional maps at optimal scales. This map uses 110m scale Natural Earth data on an unusual projection - the Spilhaus Ocean Map in Square Projection.
November 23, 2025 at 2:24 AM
30 Day Map Challenge
Day 22: Natural Earth
#30daymapchallenge #30daymapchallenge2025
Natural Earth Data is created for world and regional maps at optimal scales. This map uses 110m scale Natural Earth data on an unusual projection - the Spilhaus Ocean Map in Square Projection.
Day 22: Natural Earth
#30daymapchallenge #30daymapchallenge2025
Natural Earth Data is created for world and regional maps at optimal scales. This map uses 110m scale Natural Earth data on an unusual projection - the Spilhaus Ocean Map in Square Projection.
Reposted by Darakhshan Nehal

My fiancée treats the cats to cream every night after her shower. They may have learned to wait for her.

November 23, 2025 at 3:37 AM
My fiancée treats the cats to cream every night after her shower. They may have learned to wait for her.
Reposted by Darakhshan Nehal

Since you all loved Kitty Omega, here’s Mercury! He’s the baby of the house.


November 22, 2025 at 4:10 PM
Since you all loved Kitty Omega, here’s Mercury! He’s the baby of the house.
Reposted by Darakhshan Nehal


Reposted by Darakhshan Nehal
“Smear microscopy is basically how we’ve been diagnosing tuberculosis since 1882, and I really think it’s time to say goodbye”
@johngreensbluesky.bsky.social nailed it!!
It really is time to offer a WHO approved rapid molecular test to all people with presumed tuberculosis!!
@johngreensbluesky.bsky.social nailed it!!
It really is time to offer a WHO approved rapid molecular test to all people with presumed tuberculosis!!
November 21, 2025 at 7:53 PM
“Smear microscopy is basically how we’ve been diagnosing tuberculosis since 1882, and I really think it’s time to say goodbye”
@johngreensbluesky.bsky.social nailed it!!
It really is time to offer a WHO approved rapid molecular test to all people with presumed tuberculosis!!
@johngreensbluesky.bsky.social nailed it!!
It really is time to offer a WHO approved rapid molecular test to all people with presumed tuberculosis!!
Reposted by Darakhshan Nehal

"Poverty is expensive ... it costs time and money to navigate systems designed to exclude the poor"
When was the last time you attended a conference in the Global North and the keynote speaker spoke about visa injustice?
Well, @johngreensbluesky.bsky.social did just that at @theunion.org conference in Copenhagen where people had struggles with visas
Well, @johngreensbluesky.bsky.social did just that at @theunion.org conference in Copenhagen where people had struggles with visas
November 22, 2025 at 10:34 PM
"Poverty is expensive ... it costs time and money to navigate systems designed to exclude the poor"
Reposted by Darakhshan Nehal
Just missed Caturday!

November 23, 2025 at 5:01 AM
Just missed Caturday!
Reposted by Darakhshan Nehal

Almost a year now since I received this absolutely classic burn from the Canadian government.

November 21, 2025 at 9:10 PM
Almost a year now since I received this absolutely classic burn from the Canadian government.
Reposted by Darakhshan Nehal
oh wow the amount of apples in the cake is just right. it's really, really good. moist, fragrant, delicious.


November 22, 2025 at 5:04 AM
oh wow the amount of apples in the cake is just right. it's really, really good. moist, fragrant, delicious.
Reposted by Darakhshan Nehal

Christmas markets in Cologne in 2025
Each Christmas tree 🎄 shows the location of one of the 9 Christmas markets. I created a Christmas tree flat icon as an SVG and imported it into mapbox.com Studio. Finally, I discovered the particle-based snow setting. ❄
#30DayMapChallenge Day 21: Icons
Each Christmas tree 🎄 shows the location of one of the 9 Christmas markets. I created a Christmas tree flat icon as an SVG and imported it into mapbox.com Studio. Finally, I discovered the particle-based snow setting. ❄
#30DayMapChallenge Day 21: Icons
November 21, 2025 at 9:24 PM
Christmas markets in Cologne in 2025
Each Christmas tree 🎄 shows the location of one of the 9 Christmas markets. I created a Christmas tree flat icon as an SVG and imported it into mapbox.com Studio. Finally, I discovered the particle-based snow setting. ❄
#30DayMapChallenge Day 21: Icons
Each Christmas tree 🎄 shows the location of one of the 9 Christmas markets. I created a Christmas tree flat icon as an SVG and imported it into mapbox.com Studio. Finally, I discovered the particle-based snow setting. ❄
#30DayMapChallenge Day 21: Icons