


Ansgar Wolsing
@ansgarw.bsky.social
Powerpoint by day, #ggplot2 by night. Here for dataviz and #rstats content and rants about football. 📊⚽️
Based in Cologne, Germany.
Based in Cologne, Germany.
Reposted by Ansgar Wolsing


Reposted by Ansgar Wolsing

Marie-Christine Ostermann (Die Familienunternehmer) saß schon im Sept. 2011 auf dem Podium, als Hans-Olaf Henkel und Beatrix von Storch sich zum ersten Mal für die Gründung einer neuen Partei, der späteren #AfD aussprachen, was Jürgen Elsässer damals abfeierte. 1/3 web.archive.org/web/20110924...


November 25, 2025 at 9:03 AM
Marie-Christine Ostermann (Die Familienunternehmer) saß schon im Sept. 2011 auf dem Podium, als Hans-Olaf Henkel und Beatrix von Storch sich zum ersten Mal für die Gründung einer neuen Partei, der späteren #AfD aussprachen, was Jürgen Elsässer damals abfeierte. 1/3 web.archive.org/web/20110924...
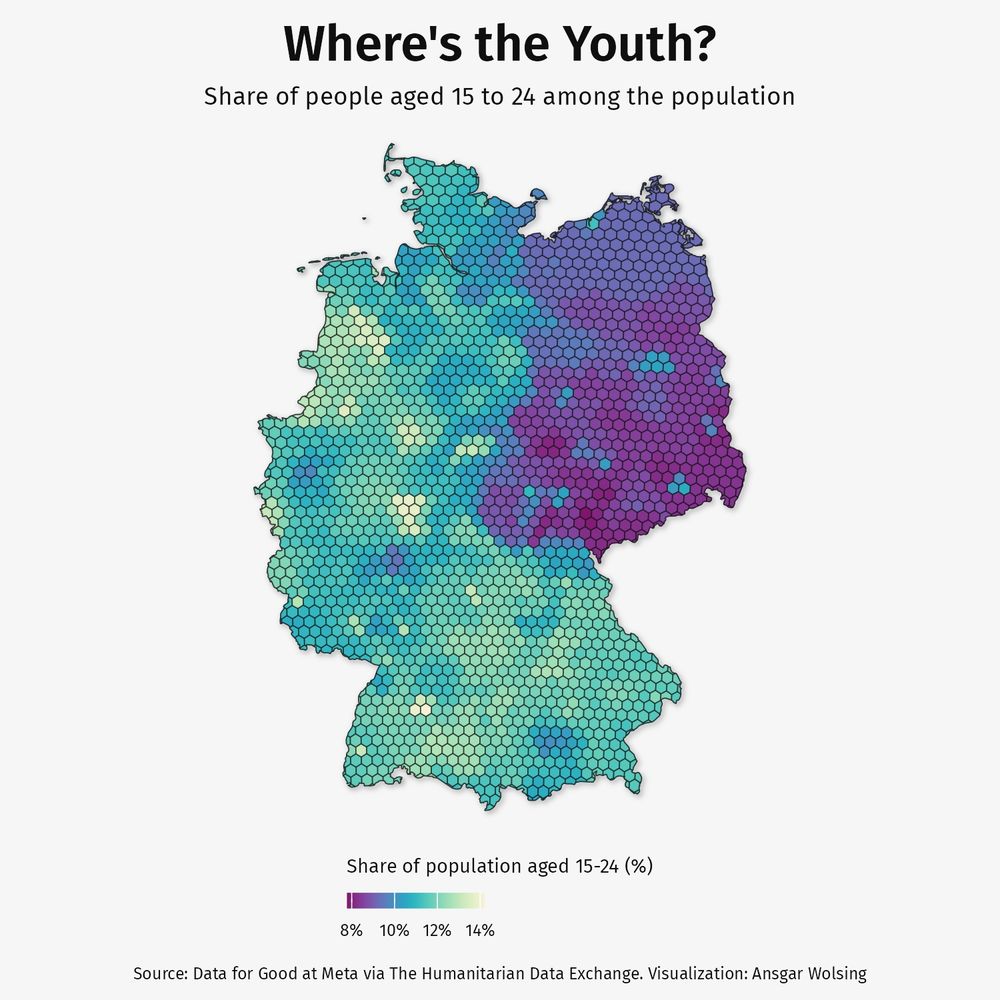
This hex-map breaks down the share of 15-24 year-olds in Germany and the regional contrast is hard to miss.
Eastern Germany shows much lower shares except for larger cities, while many western and southern areas have noticeably more young people.
#30DayMapChallenge Day 25: Hexagons #ggplot2
Eastern Germany shows much lower shares except for larger cities, while many western and southern areas have noticeably more young people.
#30DayMapChallenge Day 25: Hexagons #ggplot2
November 25, 2025 at 8:17 PM
This hex-map breaks down the share of 15-24 year-olds in Germany and the regional contrast is hard to miss.
Eastern Germany shows much lower shares except for larger cities, while many western and southern areas have noticeably more young people.
#30DayMapChallenge Day 25: Hexagons #ggplot2
Eastern Germany shows much lower shares except for larger cities, while many western and southern areas have noticeably more young people.
#30DayMapChallenge Day 25: Hexagons #ggplot2
Reposted by Ansgar Wolsing

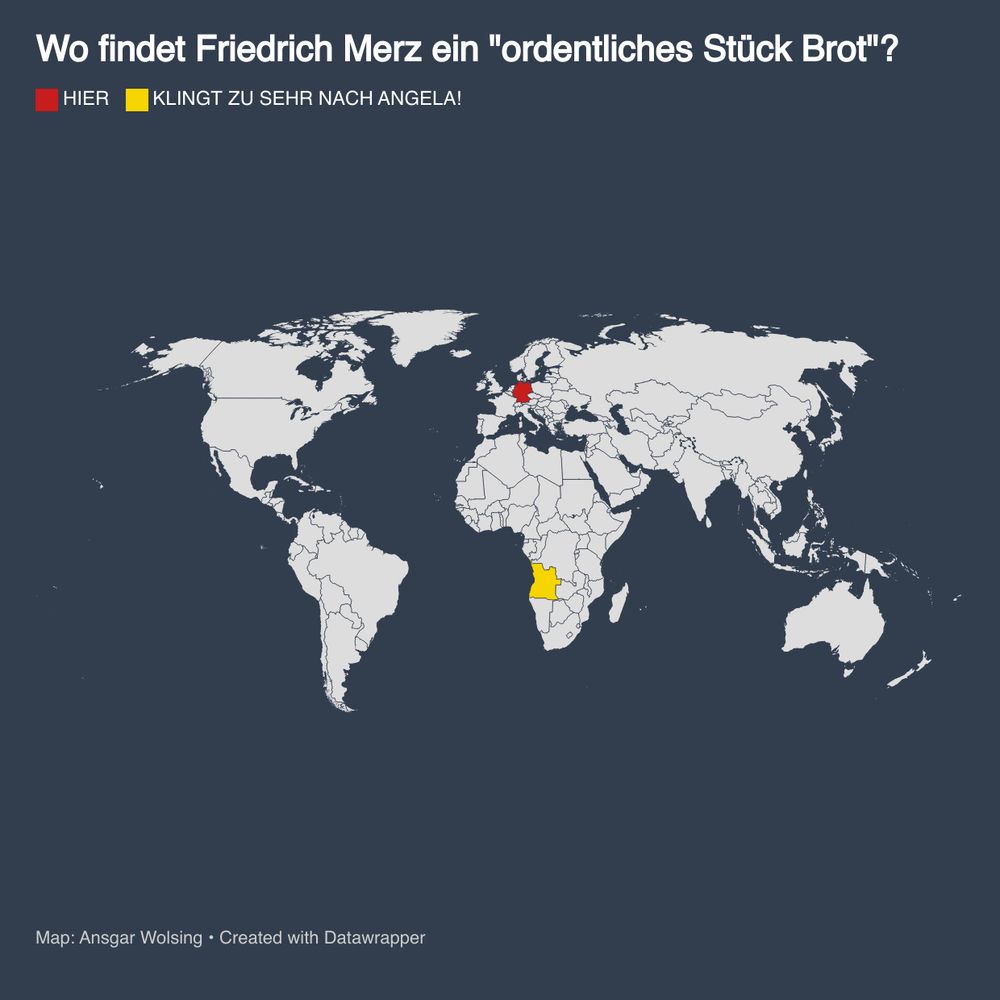
Wie konnte Friedrich Merz jemals was anderes werden als ein rassistischer Rentner in nem Kleingartenverein, der den Kindern den Fußball wegnimmt.

November 25, 2025 at 3:40 PM
Wie konnte Friedrich Merz jemals was anderes werden als ein rassistischer Rentner in nem Kleingartenverein, der den Kindern den Fußball wegnimmt.
Reposted by Ansgar Wolsing

Rosen sind rot
Kultur wird mal wieder übervorteilt
Kultur wird mal wieder übervorteilt

Berlin: Wurden Gelder aus dem Kulturetat an CDU-Parteifreunde verteilt?
Der SZ liegt ein Dossier des Ex-Finanzsenators vor, das diesen Verdacht nährt und auch Kultursenatorin Sarah Wedl-Wilson in den Fokus nimmt.
www.sueddeutsche.de
November 25, 2025 at 7:49 PM
Rosen sind rot
Kultur wird mal wieder übervorteilt
Kultur wird mal wieder übervorteilt
Reposted by Ansgar Wolsing
Demo der Karlsruher Fanszene vor Heimspiel gegen Elversberg – 4.000 KSC’ler setzen nächstes Zeichen gegen Pläne der IMK. Mehr dazu hier im Artikel ➡️ www.faszination-fankurve.de 📸: Supporters Karlsruhe #ksc #imk #fans #demo #ultras #karlsruhersc #supporterskarlsruhe
November 25, 2025 at 2:39 PM
Demo der Karlsruher Fanszene vor Heimspiel gegen Elversberg – 4.000 KSC’ler setzen nächstes Zeichen gegen Pläne der IMK. Mehr dazu hier im Artikel ➡️ www.faszination-fankurve.de 📸: Supporters Karlsruhe #ksc #imk #fans #demo #ultras #karlsruhersc #supporterskarlsruhe
Reposted by Ansgar Wolsing

somebody who is good at the economy please help them budget this, their bullshit factory is dying

OpenAI needs to raise at least $207bn by 2030 so it can continue to lose money, HSBC estimates on.ft.com/4ij0yh8

OpenAI needs to raise at least $207bn by 2030 so it can continue to lose money, HSBC estimates
A burning platform
on.ft.com
November 25, 2025 at 7:49 PM
somebody who is good at the economy please help them budget this, their bullshit factory is dying
Reposted by Ansgar Wolsing
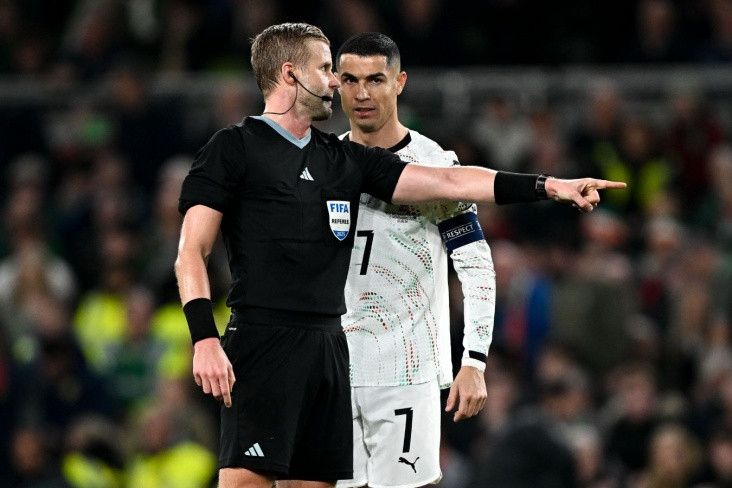
Timeline.
🔴13 Nov - Ronaldo gets red card in Portugal’s game v ireland. (Should miss opening 2 games of World Cup.)
🟠18 Nov - Ronaldo meets Donald Trump at White House.
🟢25 Nov - FIFA clears Ronaldo to play in World Cup from start.
🔴13 Nov - Ronaldo gets red card in Portugal’s game v ireland. (Should miss opening 2 games of World Cup.)
🟠18 Nov - Ronaldo meets Donald Trump at White House.
🟢25 Nov - FIFA clears Ronaldo to play in World Cup from start.

November 25, 2025 at 5:54 PM
Timeline.
🔴13 Nov - Ronaldo gets red card in Portugal’s game v ireland. (Should miss opening 2 games of World Cup.)
🟠18 Nov - Ronaldo meets Donald Trump at White House.
🟢25 Nov - FIFA clears Ronaldo to play in World Cup from start.
🔴13 Nov - Ronaldo gets red card in Portugal’s game v ireland. (Should miss opening 2 games of World Cup.)
🟠18 Nov - Ronaldo meets Donald Trump at White House.
🟢25 Nov - FIFA clears Ronaldo to play in World Cup from start.
November 25, 2025 at 7:21 PM
Reposted by Ansgar Wolsing


November 25, 2025 at 6:33 PM
Reposted by Ansgar Wolsing
As sad as it is to read another LLM-generated student proposal, at least TIL that LLMs have deeply internalized this classic PDH comic, at least the colon part: phdcomics.com/comics/archi...

Your Thesis Title
Link to phdcomics.com
phdcomics.com
November 25, 2025 at 2:21 PM
As sad as it is to read another LLM-generated student proposal, at least TIL that LLMs have deeply internalized this classic PDH comic, at least the colon part: phdcomics.com/comics/archi...
Reposted by Ansgar Wolsing

Neue Studie des @dezim-institut.de „Importierter Antisemitismus? Empirische Befunde zu antisemitischen Einstellungen in Dland"! Neben der wichtigen Empirie fällt besonders folgender Befund ins Auge: Wer der "Importthese" zustimmt, zeigt häufiger antisemitische, aber auch muslimfeindliche Haltungen
November 25, 2025 at 10:55 AM
Neue Studie des @dezim-institut.de „Importierter Antisemitismus? Empirische Befunde zu antisemitischen Einstellungen in Dland"! Neben der wichtigen Empirie fällt besonders folgender Befund ins Auge: Wer der "Importthese" zustimmt, zeigt häufiger antisemitische, aber auch muslimfeindliche Haltungen
Reposted by Ansgar Wolsing
i’m not crying you’re crying
xkcd: Fifteen Years
xkcd: Fifteen Years

Fifteen Years
xkcd.com
November 25, 2025 at 1:58 AM
i’m not crying you’re crying
xkcd: Fifteen Years
xkcd: Fifteen Years
Reposted by Ansgar Wolsing

Was für ein schlechter Scherz: Berlins CDU-Finanzsenator haut 100k für ein Gutachten gegen die Vergesellschaftung raus, geschrieben von Vonovias Kanzleien und genauso substanzlos @dwenteignen.bsky.social taz.de/Gutachten-zu...

Gutachten zur Vergesellschaftung: CDU findet Enteignung doof
Der CDU-Finanzsenat beauftragte ein Gutachten, das das Vorhaben von Deutsche Wohnen Enteignen als illegal bezeichnet. Die Kampagne widerspricht.
taz.de
November 25, 2025 at 7:03 AM
Was für ein schlechter Scherz: Berlins CDU-Finanzsenator haut 100k für ein Gutachten gegen die Vergesellschaftung raus, geschrieben von Vonovias Kanzleien und genauso substanzlos @dwenteignen.bsky.social taz.de/Gutachten-zu...
Reposted by Ansgar Wolsing

Things online are often not as they appear.

November 24, 2025 at 11:30 PM
Things online are often not as they appear.
Reposted by Ansgar Wolsing
There are 10.990 municipalities in Germany.
From Berlin to the smallest municipality. All their names are shown in this map. The 50 largest cities’ names appear one after the other, after that they appear in chunks of increasing size.
#30DayMapChallenge Day 24: Places and their names #ggplot2
From Berlin to the smallest municipality. All their names are shown in this map. The 50 largest cities’ names appear one after the other, after that they appear in chunks of increasing size.
#30DayMapChallenge Day 24: Places and their names #ggplot2
November 24, 2025 at 11:22 AM
There are 10.990 municipalities in Germany.
From Berlin to the smallest municipality. All their names are shown in this map. The 50 largest cities’ names appear one after the other, after that they appear in chunks of increasing size.
#30DayMapChallenge Day 24: Places and their names #ggplot2
From Berlin to the smallest municipality. All their names are shown in this map. The 50 largest cities’ names appear one after the other, after that they appear in chunks of increasing size.
#30DayMapChallenge Day 24: Places and their names #ggplot2
Reposted by Ansgar Wolsing

This was such a cool map animation of Germany that I had to try to make one for Sweden! But with only ≈2000 towns, so some sparsely populated areas don't show so well. #ggplot2
November 24, 2025 at 2:17 PM
This was such a cool map animation of Germany that I had to try to make one for Sweden! But with only ≈2000 towns, so some sparsely populated areas don't show so well. #ggplot2
Keta Karen is having a good time. 💩
Everything about this might be the saddest thing I’ve ever seen
November 24, 2025 at 6:59 PM
Keta Karen is having a good time. 💩
Reposted by Ansgar Wolsing

Kurios: Der Abwahlantrag der CDU-Fraktion gegen die Oberbürgermeisterin von Niesky ist von der offiziellen Webseite ("Ratsinformationssystem") verschwunden. Laut SZ weiß selbst die OB nicht, warum er plötzlich weg ist. Auf dem Antrag war zu sehen, dass die CDU mit AFD und einem Neonazi kooperiert.
Jetzt ist der Beweis öffentlich: Die CDU hat einen Abwahlantrag gegen die Oberbürgermeisterin von Niesky eingebracht. Dazu hat sie die Unterschriften von AFD und einen bekannten Neonazi eingesammelt. Deutlicher kann eine Kooperation mit gesicherten Rechtsextremisten nicht sein. 1/3
November 24, 2025 at 12:39 PM
Kurios: Der Abwahlantrag der CDU-Fraktion gegen die Oberbürgermeisterin von Niesky ist von der offiziellen Webseite ("Ratsinformationssystem") verschwunden. Laut SZ weiß selbst die OB nicht, warum er plötzlich weg ist. Auf dem Antrag war zu sehen, dass die CDU mit AFD und einem Neonazi kooperiert.
Reposted by Ansgar Wolsing

Einmal mit Profis 🤦♀️


November 24, 2025 at 6:48 AM
Einmal mit Profis 🤦♀️
Reposted by Ansgar Wolsing

To whom it may concern: Das ist das Netzwerk der "Stiftung Familienunternehmen", als Google-Sheet, auf Basis der Recherchen von Greenpeace. Enjoy! docs.google.com/spreadsheets...
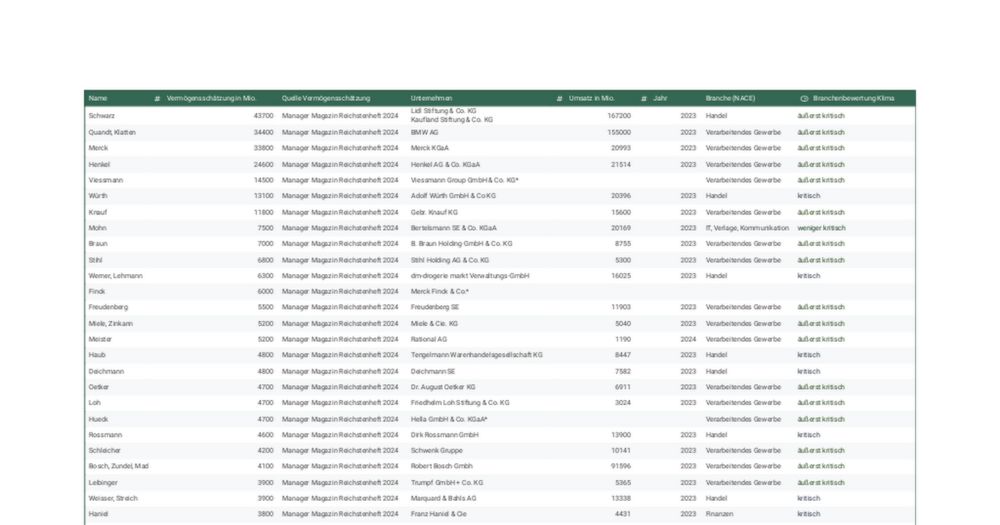
Netzwerk der "Stiftung Familienunternehmen" Quelle: Greenpeace
docs.google.com
November 24, 2025 at 10:55 AM
To whom it may concern: Das ist das Netzwerk der "Stiftung Familienunternehmen", als Google-Sheet, auf Basis der Recherchen von Greenpeace. Enjoy! docs.google.com/spreadsheets...
There are 10.990 municipalities in Germany.
From Berlin to the smallest municipality. All their names are shown in this map. The 50 largest cities’ names appear one after the other, after that they appear in chunks of increasing size.
#30DayMapChallenge Day 24: Places and their names #ggplot2
From Berlin to the smallest municipality. All their names are shown in this map. The 50 largest cities’ names appear one after the other, after that they appear in chunks of increasing size.
#30DayMapChallenge Day 24: Places and their names #ggplot2
November 24, 2025 at 11:22 AM
There are 10.990 municipalities in Germany.
From Berlin to the smallest municipality. All their names are shown in this map. The 50 largest cities’ names appear one after the other, after that they appear in chunks of increasing size.
#30DayMapChallenge Day 24: Places and their names #ggplot2
From Berlin to the smallest municipality. All their names are shown in this map. The 50 largest cities’ names appear one after the other, after that they appear in chunks of increasing size.
#30DayMapChallenge Day 24: Places and their names #ggplot2
Reposted by Ansgar Wolsing
Christmas markets in Cologne in 2025
Each Christmas tree 🎄 shows the location of one of the 9 Christmas markets. I created a Christmas tree flat icon as an SVG and imported it into mapbox.com Studio. Finally, I discovered the particle-based snow setting. ❄
#30DayMapChallenge Day 21: Icons
Each Christmas tree 🎄 shows the location of one of the 9 Christmas markets. I created a Christmas tree flat icon as an SVG and imported it into mapbox.com Studio. Finally, I discovered the particle-based snow setting. ❄
#30DayMapChallenge Day 21: Icons
November 21, 2025 at 9:24 PM
Christmas markets in Cologne in 2025
Each Christmas tree 🎄 shows the location of one of the 9 Christmas markets. I created a Christmas tree flat icon as an SVG and imported it into mapbox.com Studio. Finally, I discovered the particle-based snow setting. ❄
#30DayMapChallenge Day 21: Icons
Each Christmas tree 🎄 shows the location of one of the 9 Christmas markets. I created a Christmas tree flat icon as an SVG and imported it into mapbox.com Studio. Finally, I discovered the particle-based snow setting. ❄
#30DayMapChallenge Day 21: Icons
Reposted by Ansgar Wolsing
Bike accidents in Cologne 2024, created with Mapbox
I used the data from Day 1, group accident locations in R, and created a map using Mapbox. Finally, I added interactive tooltips showing the number of bike accidents at each location.
#30DayMapChallenge | Day 17 - A new tool
I used the data from Day 1, group accident locations in R, and created a map using Mapbox. Finally, I added interactive tooltips showing the number of bike accidents at each location.
#30DayMapChallenge | Day 17 - A new tool
November 23, 2025 at 10:41 AM
Bike accidents in Cologne 2024, created with Mapbox
I used the data from Day 1, group accident locations in R, and created a map using Mapbox. Finally, I added interactive tooltips showing the number of bike accidents at each location.
#30DayMapChallenge | Day 17 - A new tool
I used the data from Day 1, group accident locations in R, and created a map using Mapbox. Finally, I added interactive tooltips showing the number of bike accidents at each location.
#30DayMapChallenge | Day 17 - A new tool