Michele Torresani
@micheletorresani.bsky.social
500 followers
350 following
21 posts
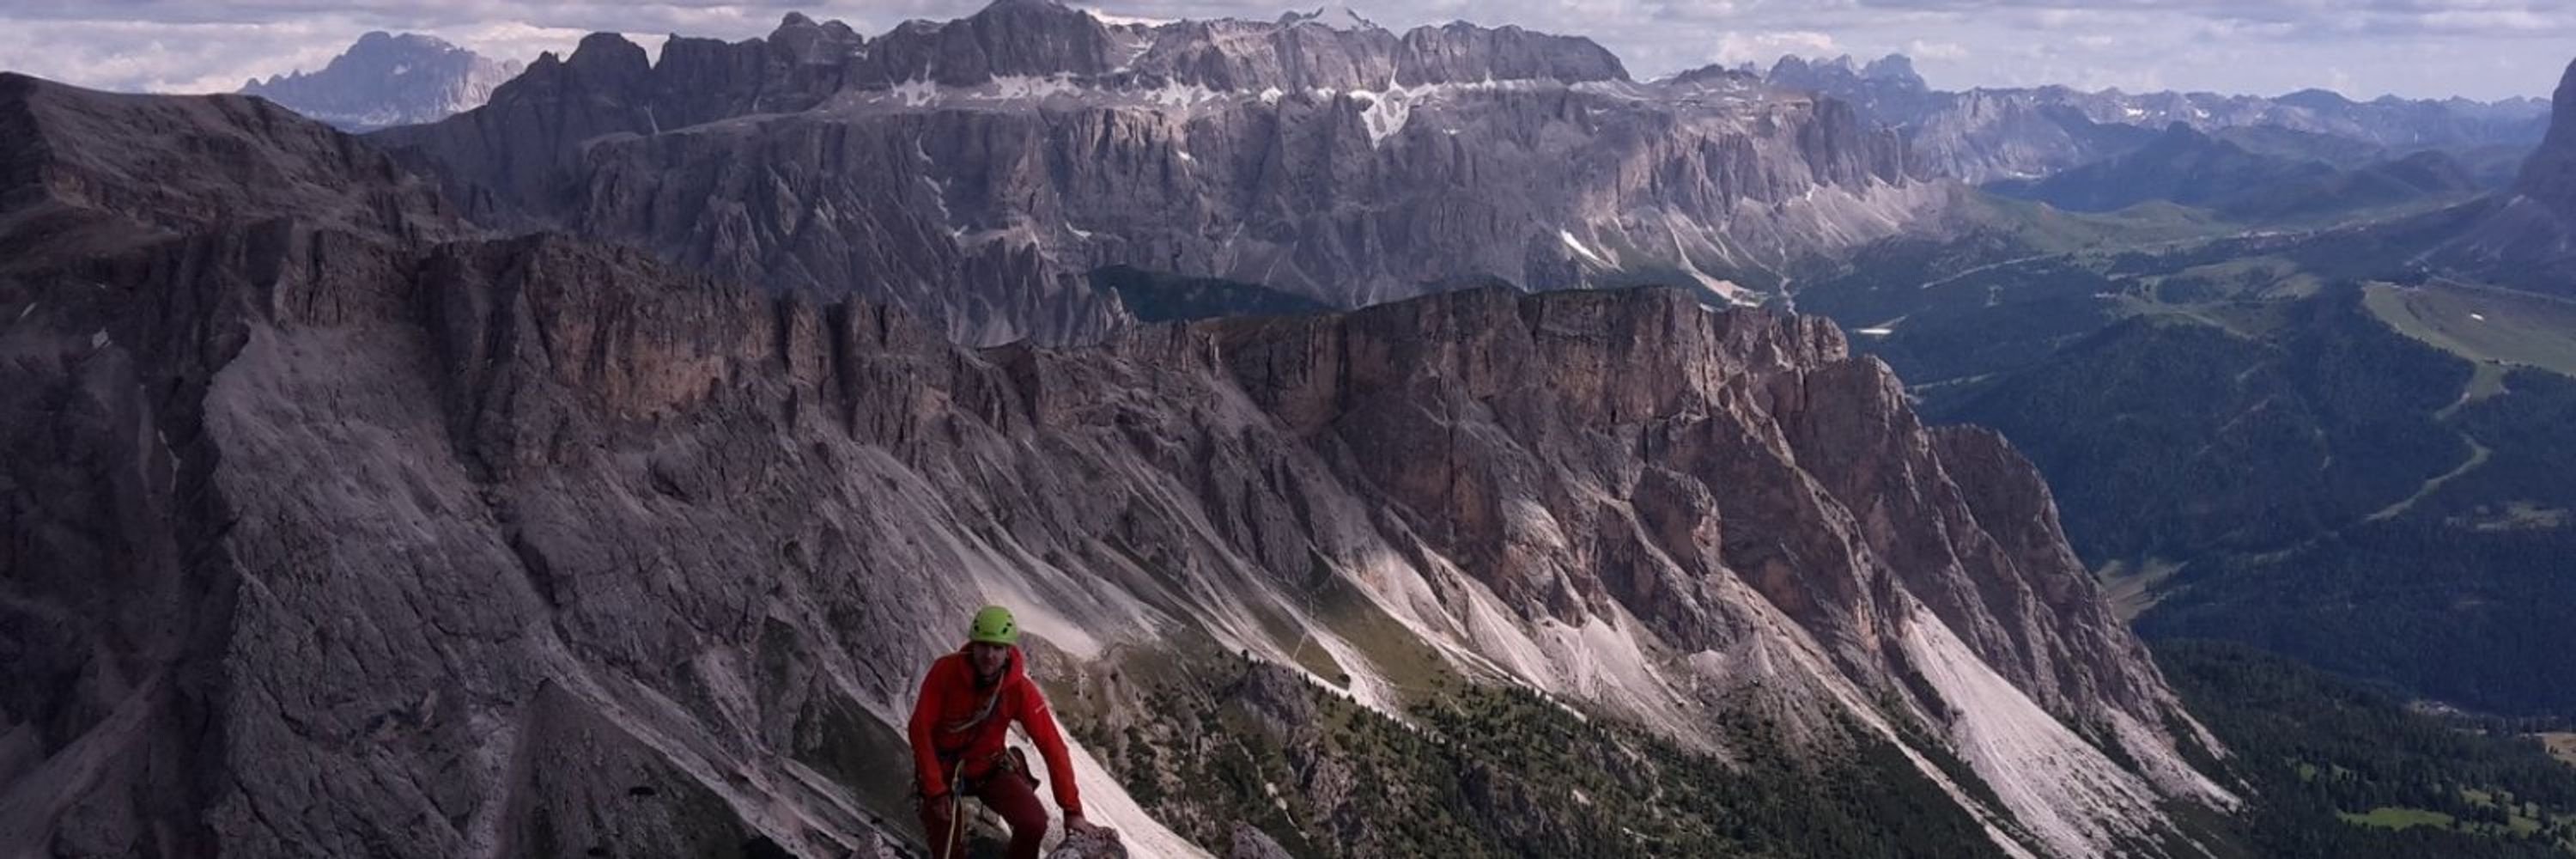
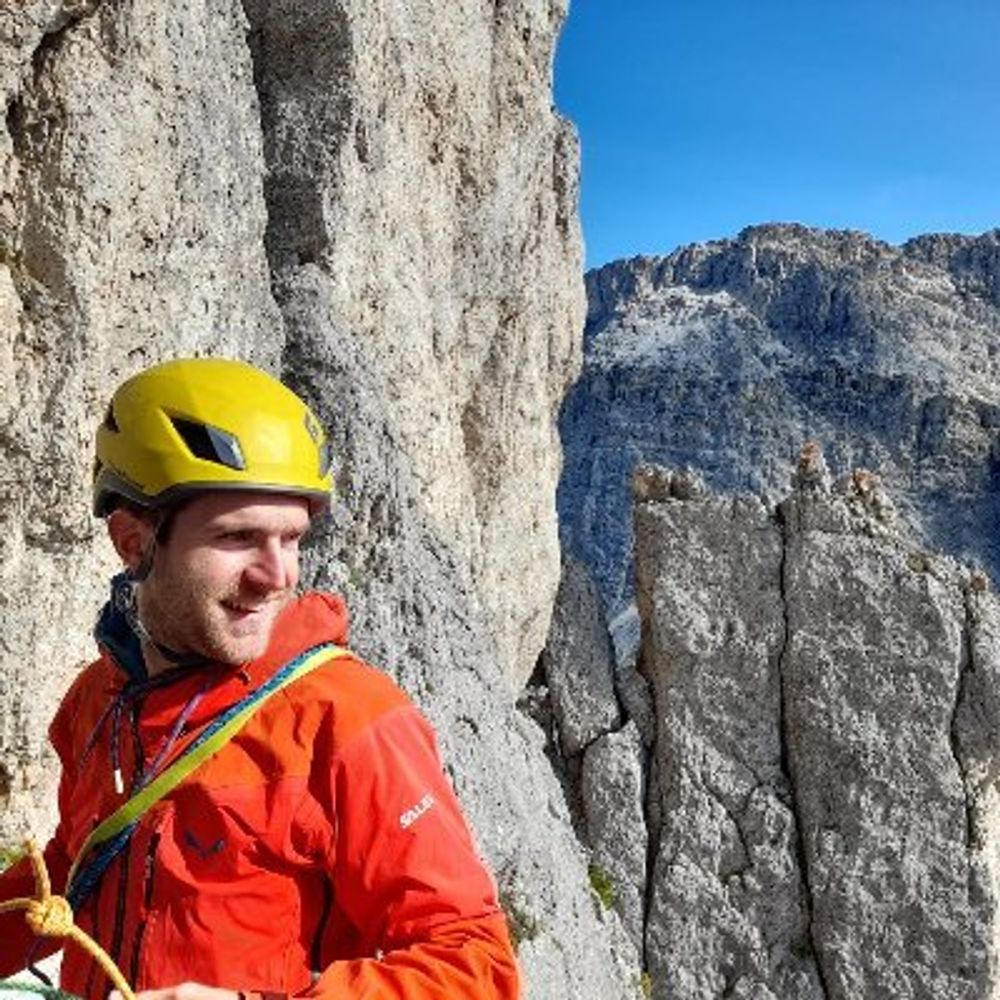
Vegetation, Forests, Biodiversity, Spatial ecology, Remote Sensing and climbing. Assistant professor at the Free University of Bolzano-Bozen
https://scholar.google.com/citations?user=A6LNYOYAAAAJ&hl=it&oi=ao
Posts
Media
Videos
Starter Packs


Reposted by Michele Torresani

Rupert Seidl
@rupertseidl.bsky.social
· Feb 3
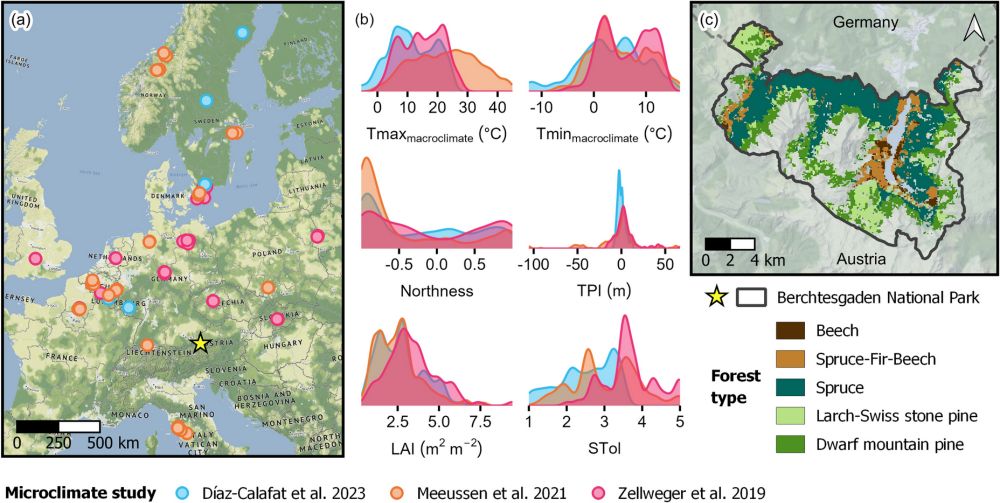
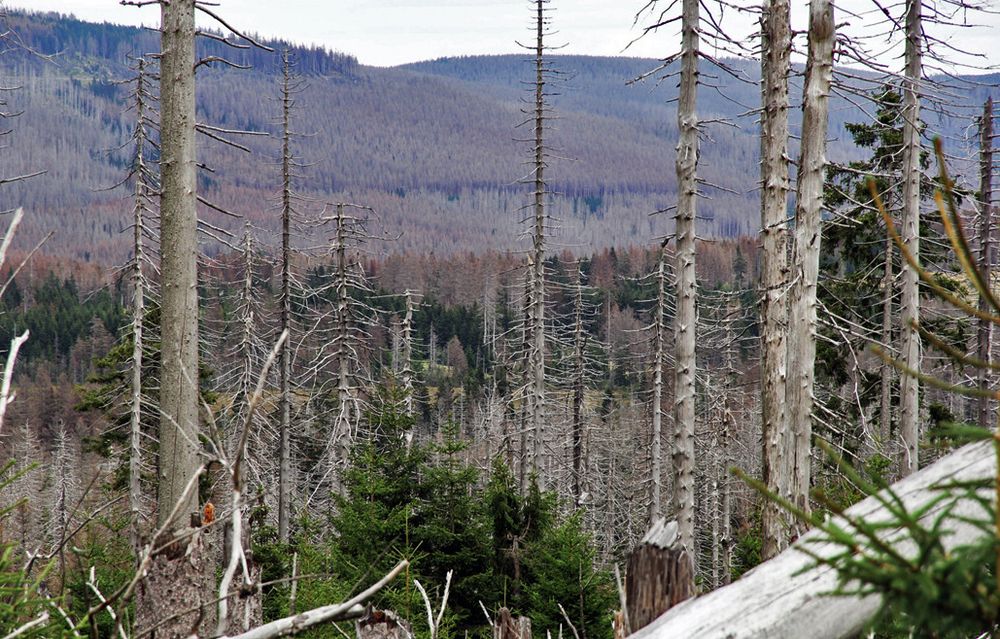
Microclimate temperature effects propagate across scales in forest ecosystems - Landscape Ecology
Context Forest canopies shape subcanopy environments, affecting biodiversity and ecosystem processes. Empirical forest microclimate studies are often restricted to local scales and short-term effects,...
doi.org


Reposted by Michele Torresani

Reposted by Michele Torresani

Reposted by Michele Torresani

Reposted by Michele Torresani
BOU
@bou.org.uk
· Jan 2

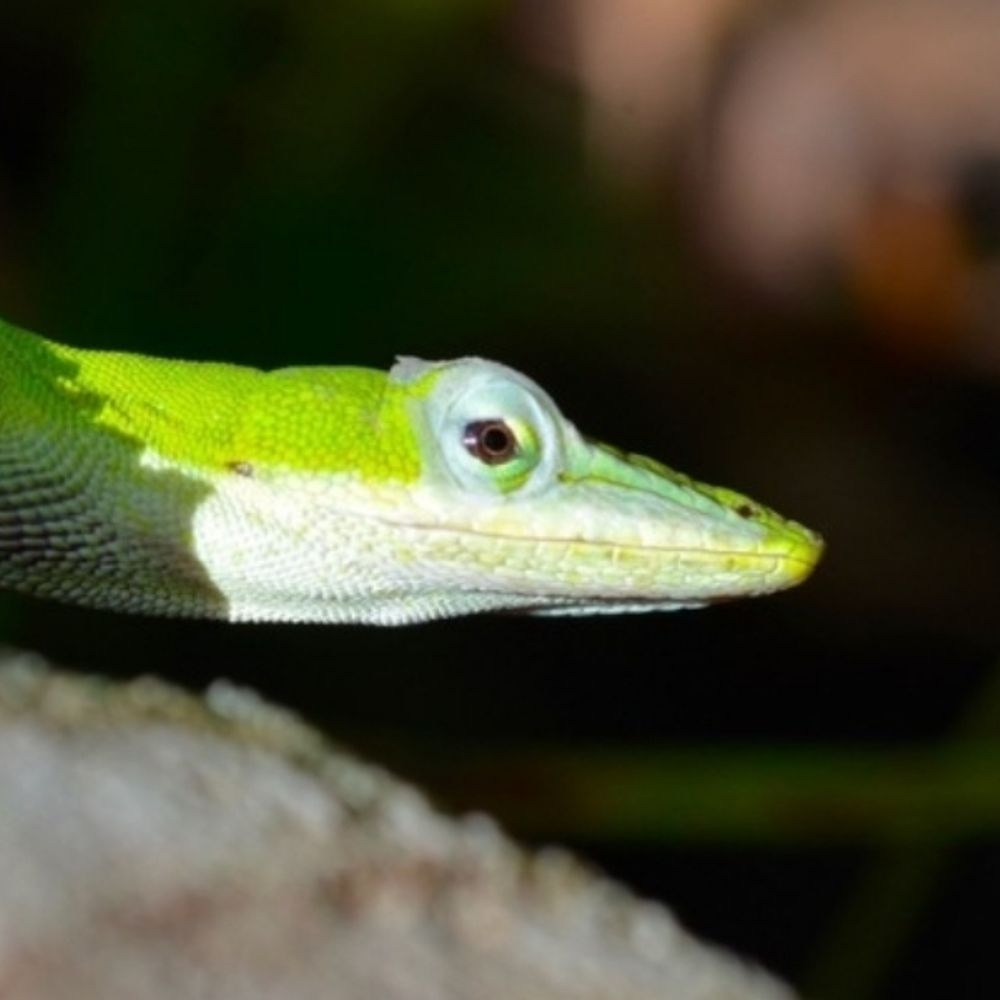
Remotely sensed spectral indicators of bird taxonomic, functional and phylogenetic diversity across Afrotropical urban and non-urban habitats
Urban areas are quickly expanding around the world, promoting deep changes in biodiversity. However, certain biogeographic realms, like the Afrotropic…
www.sciencedirect.com
Reposted by Michele Torresani