Observable
@observablehq.com
2K followers 6 following 120 posts
The collaborative data canvas
Posts Media Videos Starter Packs
observablehq.com
Glad to hear canvases looks interesting! We're happy to work with you on custom pricing for a smaller team size - and we offer a free pilot! If you'd like to test drive canvases, send us a DM with the best email to reach you, and we'll be in touch.
observablehq.com
😱 Horrified by the hours you've spent building dashboards that end up rotting in forgotten bookmarks? Observable Canvases simplify development, boost collaboration, & put interactive charts at your fingertips, so you can deliver better dashboards that stay alive for the long haul: buff.ly/43H8IKQ
observablehq.com
Despite claims that dashboards are dead, they remain a highly requested BI deliverable.

New features in Observable Canvases, like our streamlined viewer experience and control nodes, make dashboards easier to build and better to use, so they stay alive and well:
Building a better approach to dashboards in Observable Canvases
In Observable Canvases we’re building a new way to build dashboards that keeps your data workflow in one place, brings interactive charts to your fingertips, and consolidates collaboration to cut…
buff.ly
observablehq.com
We have lots of exciting treats in store for the month of October! Check back each Tuesday for new features and functionality in Observable Canvases. The first new feature drops tomorrow (and it's a big one!).
observablehq.com
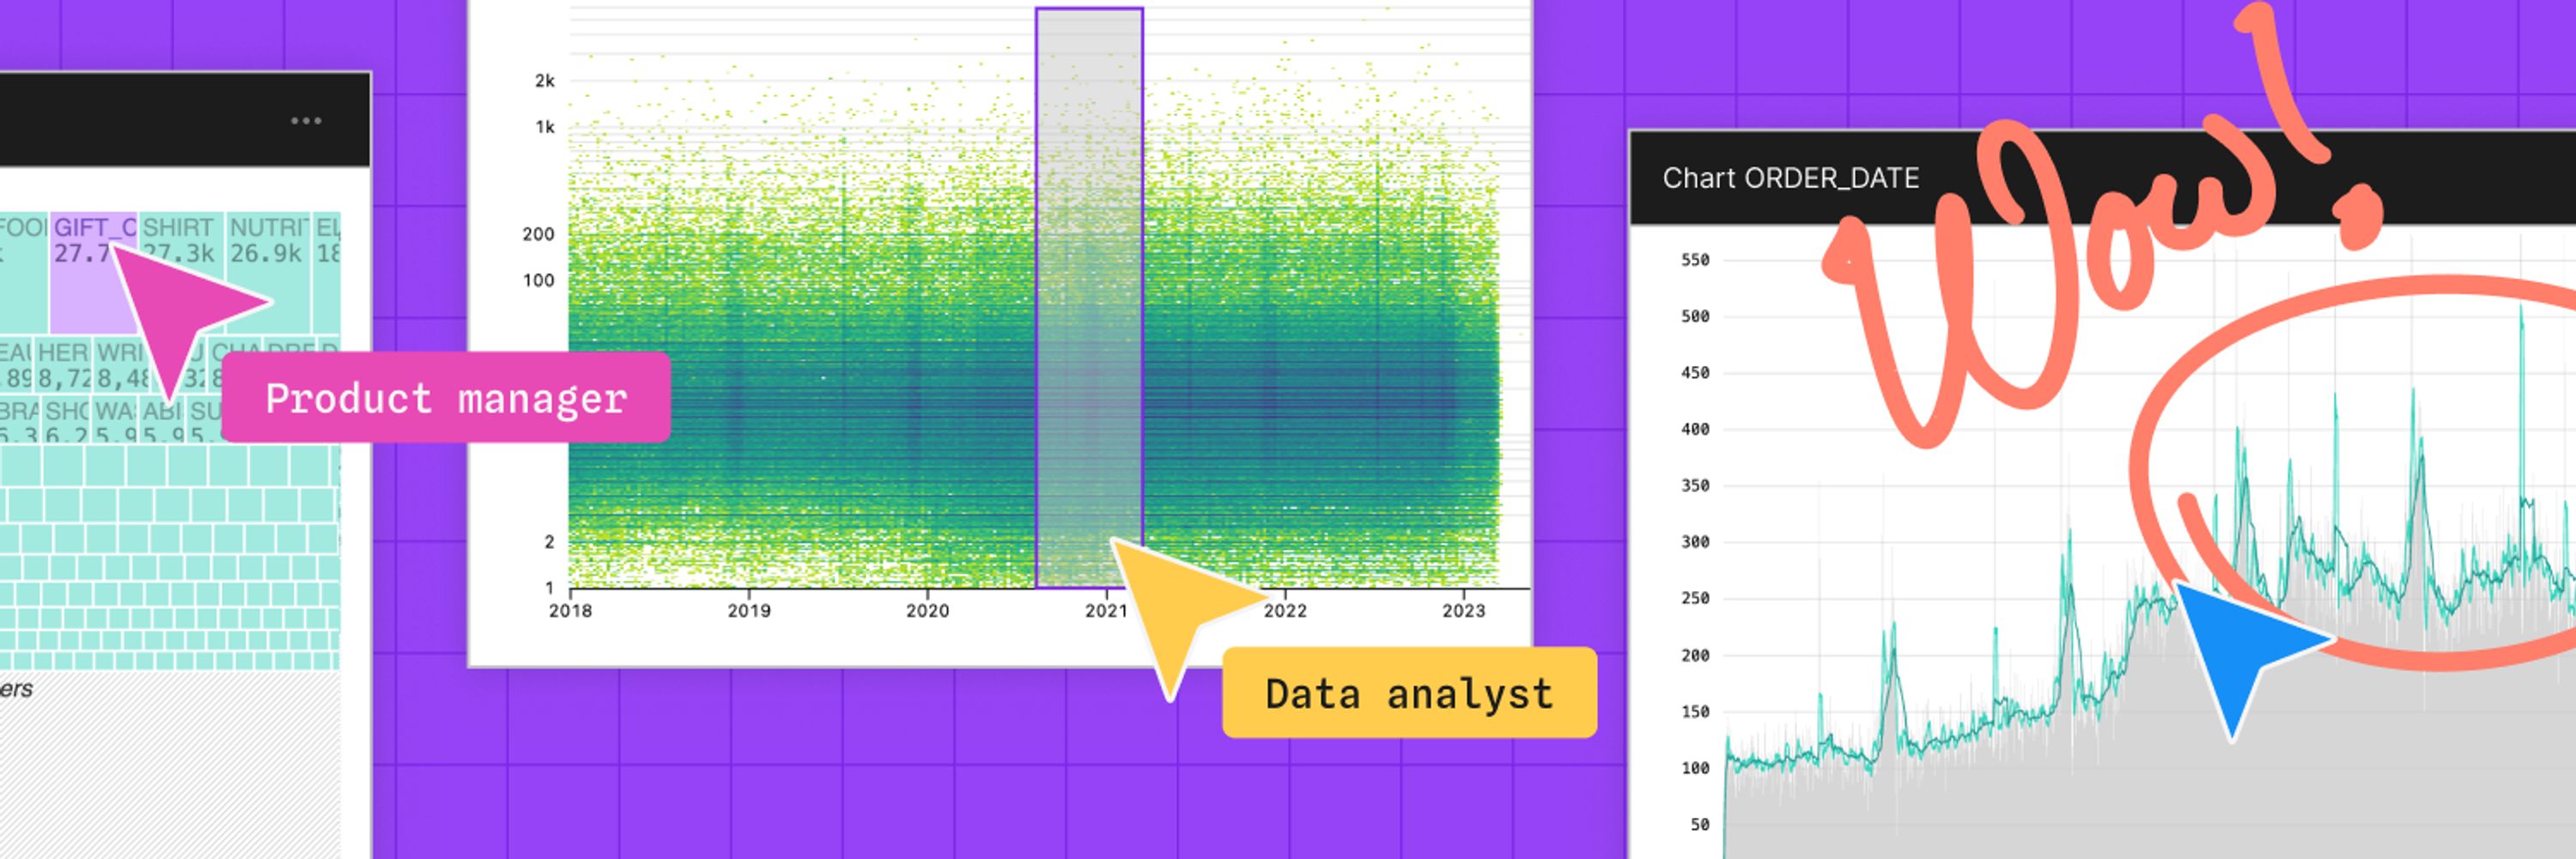
🐝 Beeswarm charts are a powerful way to explore quantitative variable distributions, and a useful alternative to more aggregated options like histograms & box plots. Meet our expanding library of state-of-the-art, interactive charts in Observable Canvases: buff.ly/SLQY7SD
observablehq.com
Data joins are everywhere in analytics, but it's tricky to build UI-based joins in a reactive canvas.

In Observable Canvases, we’ve built robust joins that avoid SELECT *, deduplicate columns, and handle upstream changes. Learn more:
Challenges underlying the humble data join
Joins are a cornerstone of data wrangling, but are surprisingly challenging to build as UI-based operations. Get a behind the scenes look into why joins are hard, and how we handle them in Observable…
buff.ly
observablehq.com
We recently announced Observable Notebooks 2.0 with a new, open notebook file format + desktop app. Now, we’ve added Python & Node.js data loaders — special cells that run at build time, for better stability and performance.

Learn more 👉
Observable Notebooks Data loaders | Observable
Data loaders are special cells that run “ahead” at build time via an interpreter, rather than “live” when you view a notebook in the browser. Data loaders are useful for preparing static data,…
buff.ly
observablehq.com
Slow-loading tables and overworked browsers can bog down analysis when you're exploring large datasets. In our new post, we explain how table virtualization in Observable Canvas keeps data work fast and fluid — even with big data, and when viewing complex, branching analyses: buff.ly/7cfqsQA
observablehq.com
Treemaps help you go beyond donut charts and stacked bars to visualize parts of a whole for hierarchical data. Learn how canvases put state-of-the-art, interactive charts like treemaps, Sankey diagrams, beeswarms, bump charts, and more at your fingertips: buff.ly/DaE8zgO
Reposted by Observable
ocks.org
Observable Plot has crossed 100,000 weekly downloads (and very close to 5,000⭐️s)! observablehq.observablehq.cloud/oss-analytic...
A time-series chart shows daily downloads of Observable Plot from npm; downloads have grown from a couple thousand per day in October 2022 to about 15,000 per day in September 2025 (7-day moving average); a tooltip shows 20,229 downloads on September 10, 2025.
Reposted by Observable
ocks.org
Observable Notebook Kit & Desktop 1.4 now support TypeScript cells, along with TypeScript for Node.js data loader cells. (Just type stripping, but greatly helps interoperability.)
observablehq.com
Observable Canvases now support BigQuery making it easy for more companies to connect, query, and build. Get started today at: buff.ly/DaE8zgO
observablehq.com
Self-serve analytics sounds great — that is, until tools overwhelm or constrain users, and adoption tanks. Our VP of Sales, Trevor Eddy, shares how collaborative analytics delivers insights and finally fulfills the promise of self-serve BI:
Why has the promise of self-serve analytics failed?
There was so much hype around the promise of self-serve analytics: data-driven insights, efficiency gains and competitive advantage. In this post, we outline why self-service analytics has failed,…
buff.ly
observablehq.com
Sankey diagrams make it easy to see how quantities flow through a system, but they're tough to build from scratch.

In Observable Canvases, you can create Sankey diagrams (plus arc maps, beeswarms, & more) in minutes — all optimized for clarity and performance: buff.ly/gsd0cpg
Reposted by Observable
ocks.org
Observable Notebook Kit and Desktop 1.3.0 are out, featuring data loader cells. You can now (finally!!) write Python and Node.js in notebooks. 🐍 observablehq.com/notebook-kit...
observablehq.com
Bump charts show how rankings shift over time, and are a great option when order matters more than absolute values. In Observable Canvases, you can now build & share responsive bump charts with just a few clicks. See what's new in our summer release: buff.ly/ZDxrAvt
observablehq.com
For one of the most common operations in all of data wrangling, implementing UI-based data joins is anything but straightforward. Software engineer Tony Sullivan shares some unexpected challenges behind joins and how we handle them in Observable Canvases: buff.ly/4FRU9C9
observablehq.com
Join us tomorrow, Thursday, September 4 at 10am PT, for a webinar showcasing the latest features in Observable Canvases, including new chart types, additional data sources, and improved dashboards: buff.ly/QPox1Oj
What’s new in Observable Canvases
Observable Canvases just got a lot more powerful. In this live webinar, our product experts and engineers will demonstrate what's new in canvases, including new advanced chart types, enhanced sharing…
buff.ly
observablehq.com
Observable Canvases make it lightweight to share interactive charts and tables as a natural extension of your data analysis. Embed canvas nodes into your internal data apps, or draw a frame around part of your canvas to generate a tidy dashboard view. Learn more: buff.ly/Bw8nukG
Reposted by Observable
naelshiab.bsky.social
My most popular interactive @observablehq.com notebook, Math for Journalists, just got a fresh update! 🧑‍🎓

👉 Sample size and confidence: I explain how sample sizes work, like in a survey.
👉 Tests for statistical significance: I break down what "statistically significant" means.

Link in comments! 👇
observablehq.com
In Observable Canvases, we’re putting advanced, interactive charts at your fingertips. Make Sankey diagrams, beeswarm charts, arc maps, bump charts, and more in just a few clicks. Learn how canvases streamline data visualization and analysis: buff.ly/ATVg0sw
observablehq.com
Observable Canvases just got a major upgrade. Join our live webinar on September 4 at 10 AM PT to learn about new chart types, extended sharing options including quick embeds, improved workspace permissions, and more: buff.ly/QPox1Oj
Reposted by Observable
ocks.org
Observable Notebook Kit and Desktop 1.1 are out. Headline feature: database connectors! 🎉 You can now query DuckDB, SQLite, Postgres, and Snowflake directly from notebooks. And it’s self-hosted. And it saves results automatically for performance and stable analysis. observablehq.com/notebook-kit...
Observable Notebooks Database connectors | Observable
observablehq.com
observablehq.com
📣 Today we’re announcing big updates in Observable Canvases. Learn about our growing suite of built-in, interactive charts (Sankey diagrams, arc maps, beeswarms + more), new embeds and dashboards for fast sharing, added Postgres and Databricks support, and more:
Observable Canvases: New chart types, dashboards, and easier ways to share
Our biggest release yet for Observable Canvases is here with new chart types, support for internal embedding, and dashboard creation.
buff.ly