Sam Burgess
@oceanterra.org
13K followers
590 following
210 posts
Climate | ocean | science policy & diplomacy | Copernicus Climate Change Service, @ECMWF | Partner to @edhawkins.org | ex 🐼 | Views own | 🌍 🌡🌊 🛰 🪸| Born on Wurundjeri Country | 🇦🇺🇬🇧🇪🇺 |
www.pulse.climate.copernicus.eu
Posts
Media
Videos
Starter Packs
Pinned


Sam Burgess
@oceanterra.org
· 11d
Network Rail gears up for Autumn as ‘Ctrl Alt Deleaf’ takes to the tracks
Leaves are browning, autumn is around the corner and Network Rail is gearing up for its annual multi-million-pound battle against Mother Nature and ‘leaves on the line’, aiming to keep millions of pas...
www.networkrailmediacentre.co.uk


Sam Burgess
@oceanterra.org
· Aug 20

Thermal trace: Decades of heat and cold stress data at your fingertips
The new Thermal Trace application, developed by the Copernicus Climate Change Service (C3S) and ECMWF*, allows us to explore, visualise, share and extract over 80 years of thermal stress data in a few...
climate.copernicus.eu
Sam Burgess
@oceanterra.org
· Aug 20

Reposted by Sam Burgess


Sam Burgess
@oceanterra.org
· Aug 14


Sam Burgess
@oceanterra.org
· Jul 10

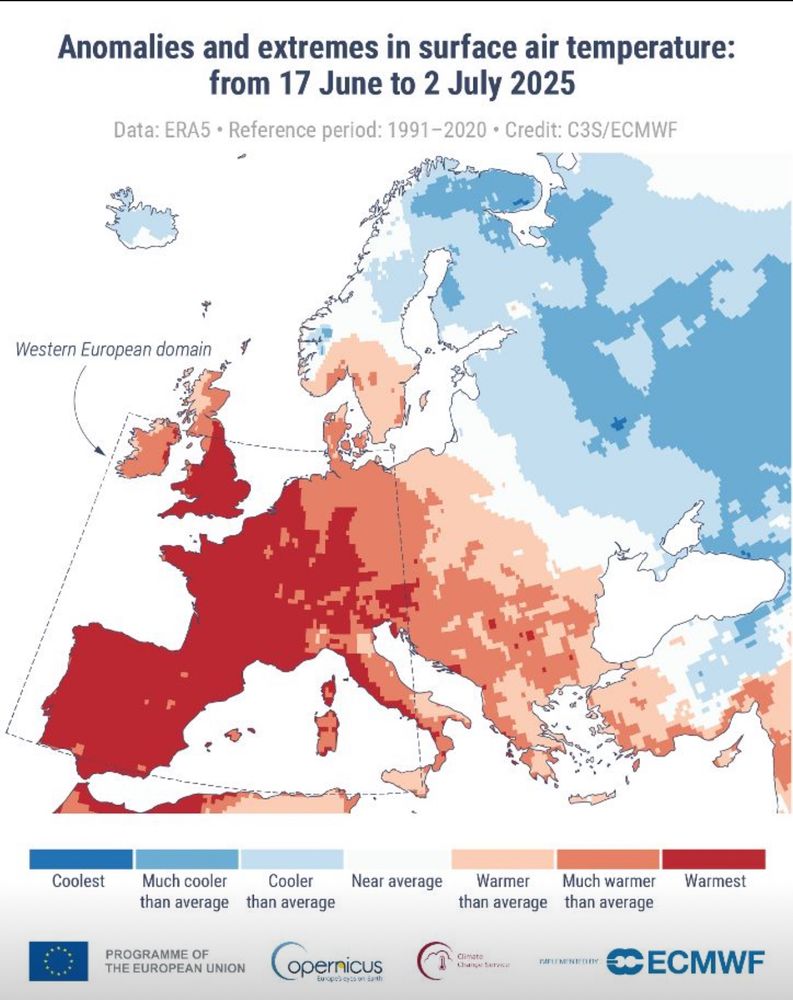
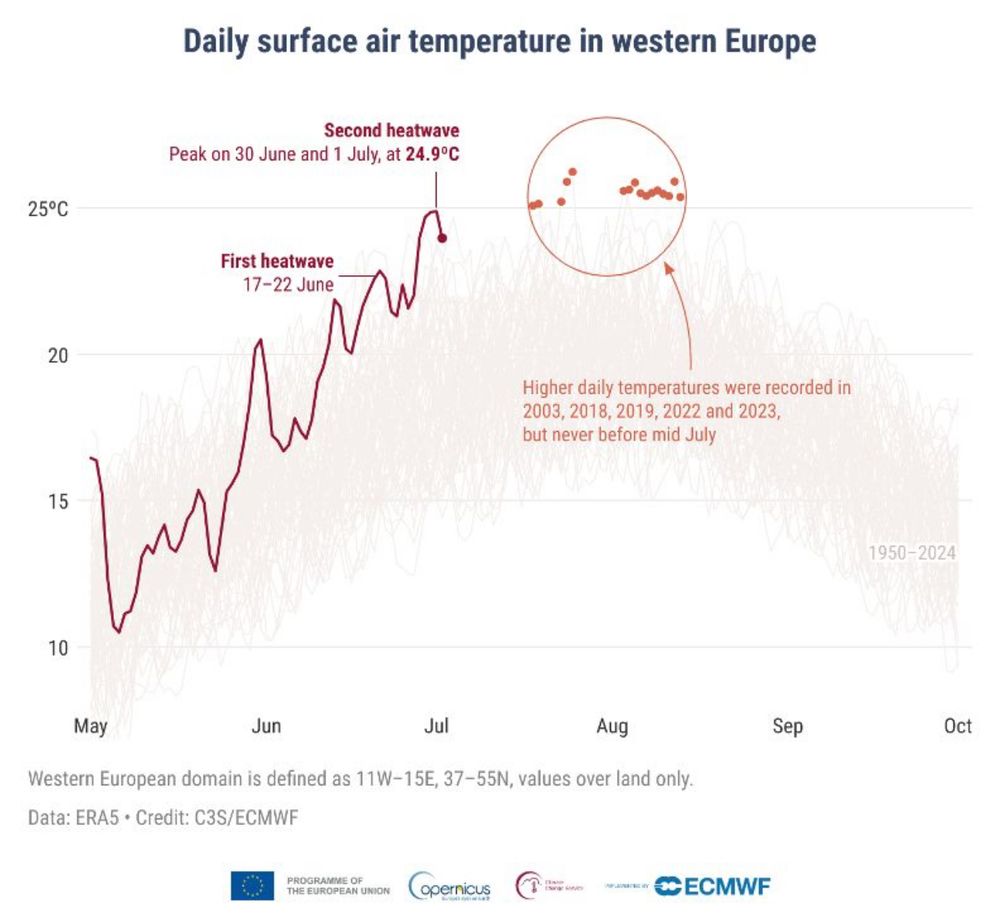
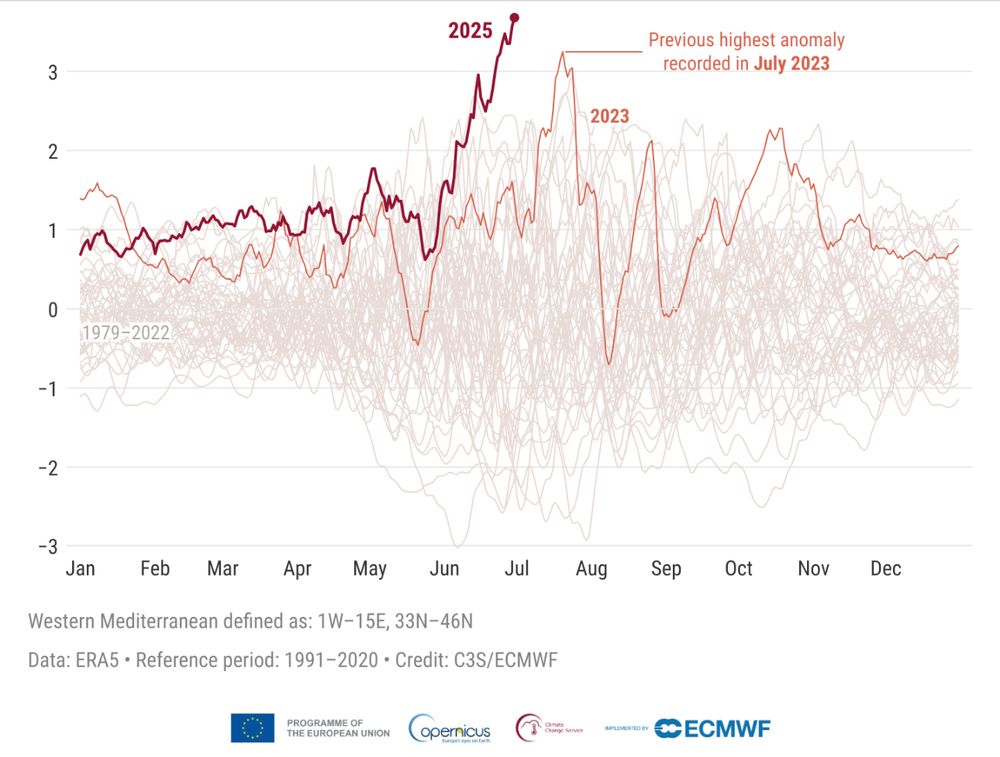
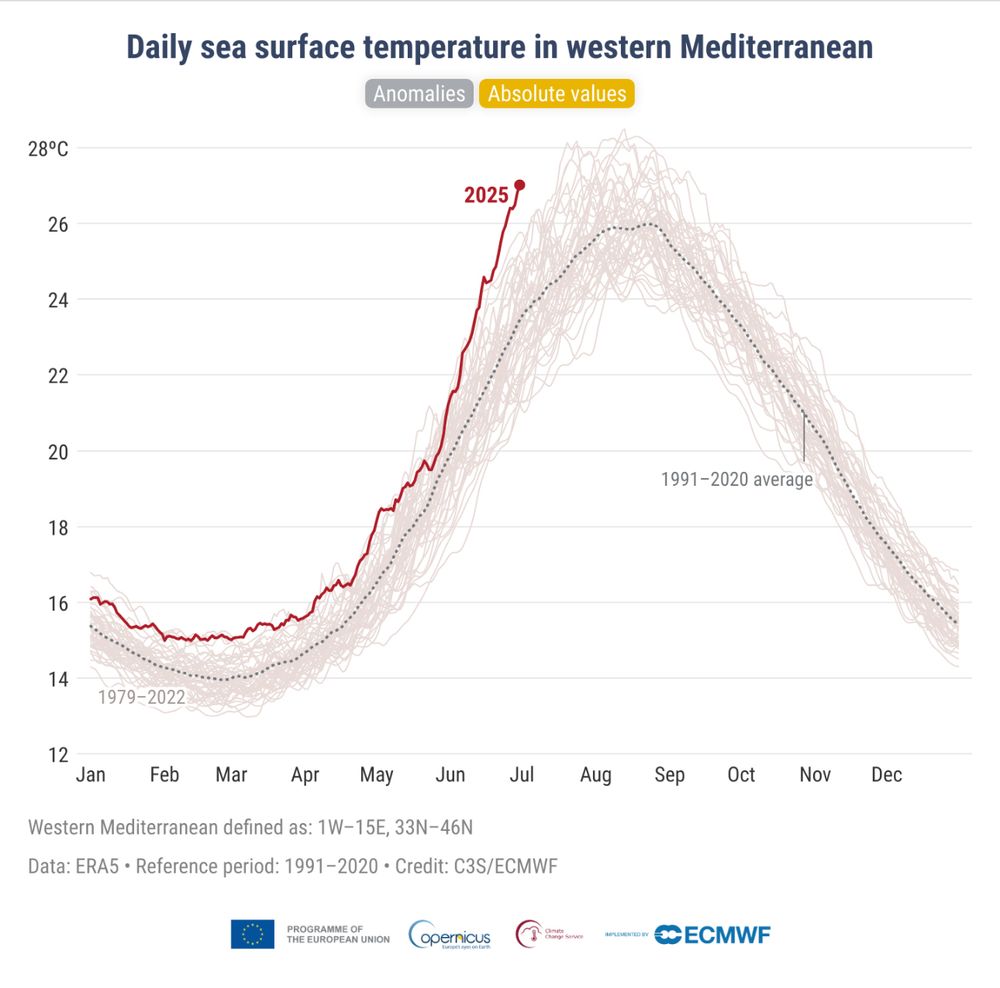
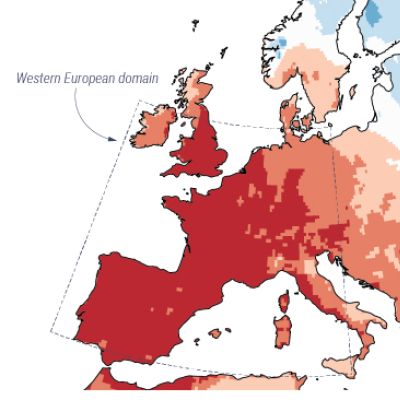
Heatwaves contribute to the warmest June on record in western Europe
The European continent experienced two significant heatwaves in mid-June and late June-early July 2025. The first event peaked between 17 and 22 June, affecting large parts of western and southern Eur...
climate.copernicus.eu
Sam Burgess
@oceanterra.org
· Jul 9
Copernicus: Third-warmest June globally – Heatwaves in Europe amid temperature extremes across both hemispheres
The Copernicus Climate Change Service (C3S), implemented by the European Centre for Medium-Range Weather Forecasts on behalf of the European Commission with funding from the EU, routinely publishes mo...
climate.copernicus.eu