Our World in Data
@ourworldindata.org
44K followers 17 following 1.9K posts
Research and data to make progress against the world’s largest problems. Based out of Oxford University (@ox.ac.uk), founded by @maxroser.bsky.social.
Posts Media Videos Starter Packs
Pinned
ourworldindata.org
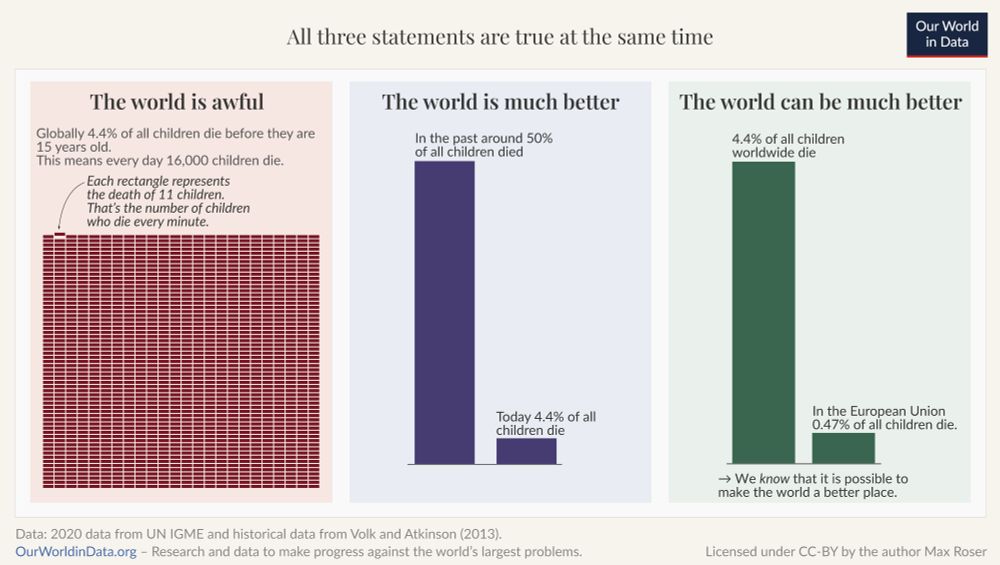
The world is awful. The world is much better. The world can be much better.

All three statements are true at the same time. Understanding this is key to solving big global problems.

We believe data & research can help us understand both the problems we face & the progress that’s possible. 🧵
A chart in three parts showing data on child mortality to make the points that "The world is awful. The world is much better. The world can be much better. All three statements are true at the same time."
ourworldindata.org
This is often the case: the first countries to improve living conditions usually needed much longer than some of those countries catching up later — the latter can learn from what worked elsewhere.

(This Data Insight was written by @maxroser.bsky.social.)
ourworldindata.org
As this chart shows, two centuries ago, about one in three children in Sweden died before they were five years old.

Since then, the child mortality rate in Sweden has declined to 0.3%.

South Korea achieved a similar reduction much faster.
ourworldindata.org
Declining child mortality, fast and slow
The image depicts a line chart illustrating child mortality rates, specifically the estimated percentage of newborns who do not survive past the age of five. The chart has two distinct lines: one representing Sweden in blue and the other representing South Korea in red. 

Starting in the early 1800s, the blue line for Sweden shows a gradual decline in the child mortality rate, fluctuating around 35% at the beginning and continuing to decrease steadily over the years, reaching nearly 0% by 2023. 

In contrast, the red line for South Korea begins more steeply in the mid-20th century, experiencing a rapid decline after 1950, ultimately approaching a very low percentage by 2023. 

The sources for the data are listed at the bottom as Gapminder (2015) and the UN Inter-agency Group for Child Mortality Estimation (2025). The entire chart is labeled as CC BY for Creative Commons licensing.
ourworldindata.org
We wrote this article so that you, the reader, are aware of a significant disconnect between what we often hear and what actually happens.

It’s easy to conflate what we see in the news with the reality of our world, and keeping this mismatch in mind can help you avoid falling into this trap.
ourworldindata.org
Our point is not that we should want or expect the media’s coverage to perfectly match the real distribution of deaths, although we’d argue that it would be better if it were less skewed.
ourworldindata.org
However, as we discuss in a new article, the media focuses on a particular sliver of our world, leaving much of the “vast and diverse world” largely out of their reporting. We investigate this through the lens of health, looking at causes of death and reporting in the United States.
ourworldindata.org
Here are several quotes from the New York Times’s mission statement:

“We seek the truth and help people understand the world. [...]

We help a global audience understand a vast and diverse world.”
ourworldindata.org
It’s not just that people expect the news to inform them about what’s going on in the world. Most think that it does. When asked what emotions the news generates, “informed” was the most common response.

This is what media outlets themselves promise to do.
ourworldindata.org
More than 80% of people — including surveyed Americans, Brits, Germans, and Italians — say they follow the news because they “want to know what is going on in the world around them.”
ourworldindata.org
Does the news reflect what we die from?
The image presents a comparison of the leading causes of death in the United States for 2023 and the media coverage these causes receive from three news outlets: The New York Times, The Washington Post, and Fox News. 

In the footer, it notes the data sources, indicating that the information is based on media mentions from Media Cloud (2025) and death data from the US CDC (2025) and the Global Terrorism Index, with a clarification that values are normalized to sum to 100%.
ourworldindata.org
Given that smoking is one of the leading risk factors for disease burden and premature death, these differences matter a lot for public health.
ourworldindata.org
The differences are large. In France and Greece, around one-third of adults use tobacco, more than twice the rate in countries like Denmark, the UK, and Norway.
ourworldindata.org
This is not just my imagination; this anecdotal evidence is backed up by the data on smoking rates.

In the chart, you can see the share of adults who say they currently use tobacco products (mostly cigarettes, but chewing tobacco is also included) across a range of countries in Western Europe.
ourworldindata.org
(This Data Insight was written by @hannahritchie.bsky.social.)

As someone born and living in the United Kingdom, one thing I notice when visiting other countries in Western Europe is how much more common smoking is elsewhere.
ourworldindata.org
Smoking rates vary a lot across Western Europe
The image presents a bar graph illustrating the smoking rates among adults aged 15 years and older across various countries in Western Europe for the year 2022. The bar heights represent the percentage of adults who used any form of tobacco, excluding e-cigarettes. 

France has the highest smoking rate at 35%, followed closely by Greece at 33%. Spain follows with 28%, then Belgium at 27%, and Portugal, Switzerland, and Austria, all at 26%. Sweden reports a rate of 23%, while both Italy and Finland have rates of 22%. The Netherlands and Germany each have a smoking rate of 21%. Ireland reports 19%, Denmark at 16%, and the UK and Norway both have the lowest rates at 14%. 

Additionally, a note indicates that the smoking rates in France and Greece are more than twice as high as those in Denmark, the UK, or Norway. 

The data source is the World Health Organization, specifically the Global Health Observatory, and the information is labeled as "CC BY," indicating it is licensed for reuse.
ourworldindata.org
Cultural factors also matter. Biomass is often seen as “free” and convenient, and families are used to traditional cookstoves and the flavors they generate. They might be unaware of how damaging this pollution is to their health and skeptical of the damage that alternatives such as LPG could do.
ourworldindata.org
Some of Bangladesh’s neighbors — like India — have given subsidies to help households switch; Bangladesh has not, making clean cooking fuels less affordable.
ourworldindata.org
Why has progress been so slow? The main barrier is economic. Bangladesh produces very little liquefied petroleum gas (LPG), relying instead on volatile imports. Its lack of domestic distribution networks also pushes prices, making clean cooking fuels expensive for consumers.
ourworldindata.org
In Bangladesh, deaths from indoor air pollution are higher than the average in low-income countries, even though those countries usually have worse overall health. Indoor air pollution is close to being the country’s largest risk factor for early death.
ourworldindata.org
The costs are huge. Using biomass for cooking damages forests and harms health because people breathe in smoke and particulates.
ourworldindata.org
Fewer than 30% of households cook with gas, electricity, or improved stoves; most still rely on wood, crop waste, or straw. The chart shows that clean fuel usage is well below the levels reached by its Asian neighbors.