Pew Research Center
@pewresearch.org
50K followers 32 following 610 posts
Nonpartisan, nonadvocacy data and analysis. Visit us at https://www.pewresearch.org/
Posts Media Videos Starter Packs
Pinned
pewresearch.org
Hey there, Bluesky!

We are excited to share our data and insights here with you, and so are our researchers: go.bsky.app/3QzdR9p

What would you like to see from us? Drop suggestions below!
pewresearch.org
Eight-in-ten Americans say they are at least somewhat concerned about starvation among Palestinians in Gaza, Israeli military strikes killing Palestinian civilians and the remaining Israeli hostages not being returned to Israel. www.pewresearch.org/...
Chart shows Many Americans have concerns about starvation in Gaza, military strikes’ impact on Palestinian citizens and the return of Israeli hostages
pewresearch.org
Americans continue to hold much more positive views of the Israeli and Palestinian peoples than of their political leadership. www.pewresearch.org/...
Chart shows Americans view the Israeli and Palestinian people more favorably than the Israeli government, Palestinian Authority or Hamas
pewresearch.org
🧑‍⚖️ They want more from big tech and lawmakers. Two-thirds say tech companies should do more to set rules for what kids can do or see online, and 55% say this for lawmakers.
Chart shows that majorities of parents want more rules around what kids do or see online. 67% say technology companies should be doing more and 55% say the same about lawmakers.
pewresearch.org
They’re people, too: Many parents struggle with their own screen time. 65% say they spend too much time on their smartphone, and 47% say they spend too much time on social media. 🎧
Chart shows that many parents also struggle with their own screen time, 65% say this about being on their smartphone and 47% say this about being on social media.
pewresearch.org
While many parents say they’re doing their best on screen time, about 4 in 10 say they could do better.
Chart shows that about six in ten parents are doing their best on screen time, but about 4 in 10 say they could do better
pewresearch.org
Parents have a lot to juggle: Most make managing screen time a daily priority. Fewer say it’s their biggest priority compared with other things we asked about, like making sure their kid gets enough sleep. 😴
Chart shows that screen time is a daily priority for most parents, but fewer say it's the biggest one. More parents said getting enough sleep, having good manners, staying active, and reading are priorities.
pewresearch.org
📱A 61% majority of parents of kids 12 and under say their kid interacts with smartphones. And older kids are much more likely to have their own smartphone than younger kids.
Chart shows that majorities of kids interact with smartphones, but older kids are more likely to have their own.
pewresearch.org
⚖️ Parents are concerned about social media: 8 in 10 say harms outweigh benefits to their child using these sites. By comparison, 46% say so about smartphones and a smaller share (29%), about tablets.
A bar chart showing parents overwhelmingly think using social media does more to harm than benefit their kids.
pewresearch.org
YouTube is on the rise, especially for the youngest kids: In 2020, 45% of parents of a child under 2 said their kid watched it. Now, that’s 62%. Overall, 85% of parents say their kid 12 or younger watches YouTube, including 51% who say they watch daily. 🎬
Chart shows that YouTube is on the rise, especially for the youngest kids. In 2025, 62% of parents of a child under 2 say their kid watches YouTube, up from 45% in 2020.
pewresearch.org
👶 Screens start young: About three-in-ten parents say their child under 2 ever uses or interacts with a tablet, about four-in-ten a smartphone and the vast majority that they watch TV.
Text reads Screens start young. When it comes to children under 2, parents say 28% use a tablet, 38% use a smartphone, 82% watch TV. Icon of a person pushing a stroller.
pewresearch.org
Kids’ tech use comes in many forms: Parents of kids age 12 and younger most commonly mention TV, tablets and smartphones, but things like video games, smartwatches and AI chatbots are part of the picture too. 🧵👇

Full analysis here: www.pewresearch.org/...
Text reads: What’s going on with kids and screens? We surveyed parents of children 12 and under – here's what we learned. Background features scattered icons of digital devices including TV, tablets, smartphones, video games, smartwatches and AI chatbots.
pewresearch.org
17 states and D.C. have holidays honoring Native Americans on the second Monday in October.

And 18 states celebrate such days, weeks or months at other times during the year.
A map of the U.S. showing that most states commemorate Indigenous history, heritage and culture in some way.
pewresearch.org
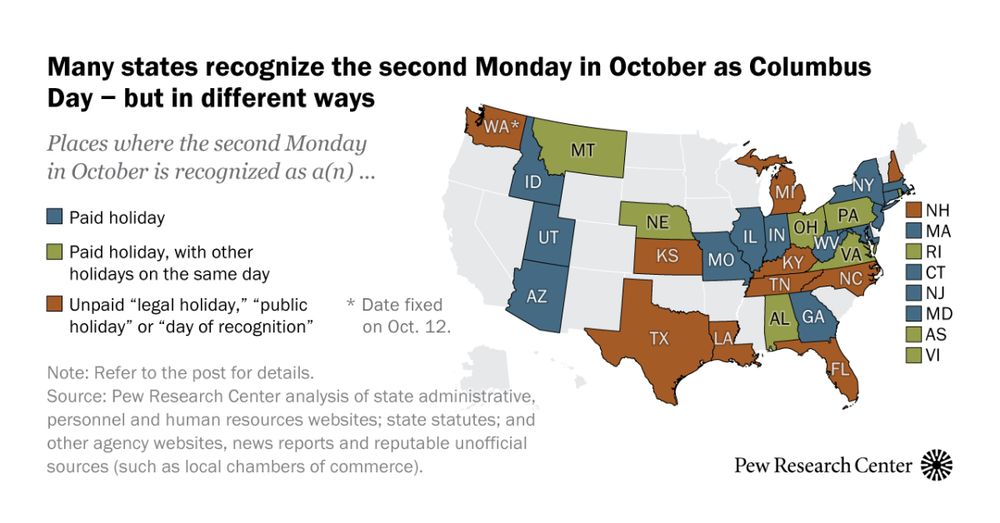
30 states and three U.S. territories recognize Columbus Day in some form, whether it be a

- Paid holiday (13 states, 1 territory)

- Paid holiday, with other holidays on the same day (7 states, 2 territories)

- Unpaid “legal holiday,” “public holiday” or “day of recognition” (10 states)
Map of the U.S. showing that many states recognize the second Monday in October as Columbus Day - but in different ways.
pewresearch.org
Workers younger than 50 and workers with a bachelor’s degree or more education are among the most likely to use AI in their job. In fact, the increase in workplace AI usage over the past year is mostly driven by the latter group. www.pewresearch.org/...
A line chart showing that AI usage has increased more among workers with a bachelor’s degree.
pewresearch.org
Today, 21% of U.S. workers say at least some of their work is done with AI. That share is up from 16% roughly a year ago. www.pewresearch.org/...
A line chart showing the share of U.S. workers using AI on the job is up 5 points since last year.
pewresearch.org
About half of Americans who have come across AI summaries in search results (53%) have at least some trust in the information from those summaries. Only 6% say they trust it a lot. Meanwhile, 46% say they do not have much trust or any trust at all in that information. www.pewresearch.org/...
A horizontal stacked bar chart showing that about half of Americans who have seen AI summaries in search results have at least some trust in that info.
pewresearch.org
A third of Americans say the U.S. gives too much military assistance to Israel; a similar share say it gives too little humanitarian aid to Gazans. www.pewresearch.org/...
Chart shows A third of Americans say the U.S. gives too much military assistance to Israel; a similar share say it gives too little humanitarian aid to Gazans
pewresearch.org
2 years into the war, Americans’ skepticism of Israel’s military operation against Hamas and the Israeli government has grown:

39% now say Israel is going too far in its military operation against Hamas
59% now hold an unfavorable opinion of the Israeli government

www.pewresearch.org/...
Chart shows 2 years into its military operation against Hamas, a growing share of Americans say Israel is ‘going too far’
pewresearch.org
U.S. adults’ ratings of the national economy continue to be more negative than positive: 26% now say economic conditions are excellent or good, while 74% say they are only fair or poor. The partisan gap on this question has widened further. www.pewresearch.org/...
A line chart showing that overall economic assessments are little changed as Republicans and Democrats continue to diverge.
pewresearch.org
In the nearly five decades that the current system for budgeting and spending tax dollars has been in place, Congress has passed all its required appropriations measures on time only four times: fiscal 1977, 1989, 1995 and 1997.
Congress has long struggled to pass spending bills on time
Congress has passed all its required appropriations measures on time only four times in nearly five decades.
www.pewresearch.org
pewresearch.org
Americans who have seen AI summaries in search results are lukewarm about their value. One-in-five say they find the information extremely or very useful, 52% say it’s somewhat useful, and 28% say it’s not too or not at all useful.
A horizontal stacked bar chart showing that 1 in 5 Americans who have seen AI summaries in search results find them extremely or very useful.
pewresearch.org
What about you? What do you think about these policies? Tell us in the replies. 💬👇