Polar Portal
@polarportal.bsky.social
340 followers 1 following 10 posts
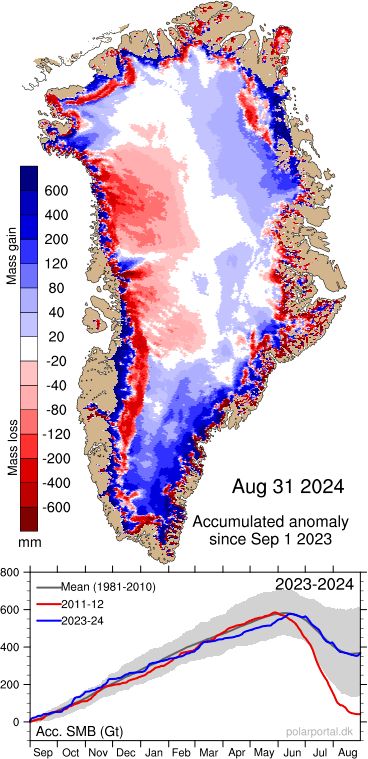
The Danish Arctic research institutions present updated knowledge on the condition of two major components of the Arctic: The Greenland Ice Sheet and the sea ice. Find us on https://polarportal.dk/en.
Posts Media Videos Starter Packs
Pinned
polarportal.bsky.social
Accumulated surface mass balance (SMB) 1 Sep 2024 to 31 Aug 2025 was 403.8 Gt (=km³), close to the average 1980-2025. SMB is snowfall - runoff, i.e. always positive.
This is NOT the total mass balance TMB, which also includes iceberg calving and which shows ice loss for the 29th year in a row.
The accumulated surface mass balance (SMB) for the "SMB year" 1 September 2024 to 31 August 2025 ended at 403.8 Gt (=km³), which is a little above the average 1980-2025, mainly due to the rather cool summer.

There is mass gain over the interior of the ice sheet and mass loss along the coasts, in particular in southwestern Greenland.
polarportal.bsky.social
PLEASE NOTE: Data source for sea ice concentration and extent has changed.

Beginning 1 July 2025, the Japanese AMSR2 is replacing the US SSMIS instrument for our sea ice concentration and extent products.

SSMIS and AMSR2 differ by ±0.1 million km² or less with larger differences in summer.
Shown are a map and a graph for sea ice extent on 8 July 2025 in the Arctic.

The map shows the sea ice extent in the Northern Hemisphere. There is only ice in the inner Arctic. 

The graph shows the annual variation in the extent of the sea ice in the Northern Hemisphere. Here, the extent of the sea ice is defined by areas that have an ice concentration of at least 15%, i.e. 15% of the surface is covered by ice. The values for 2025 are very close to or below the minimum ice extent of the last 40 years.

As the access to the SSMIS data from the US Department of Defense satellites will stop on 31 July 2025, we have replaced it with the Japanese AMSR2 data, an example of which is shown here.
polarportal.bsky.social
𝐈𝐌𝐏𝐎𝐑𝐓𝐀𝐍𝐓 𝐍𝐎𝐓𝐄: The access to SSMIS data  from the US DMSP satellites is coming to an end. 𝐓𝐡𝐞 𝐚𝐜𝐜𝐞𝐬𝐬 𝐭𝐨 𝐝𝐚𝐭𝐚 𝐰𝐢𝐥𝐥 𝐞𝐧𝐝 𝐚𝐥𝐫𝐞𝐚𝐝𝐲 𝟑𝟎 𝐉𝐮𝐧𝐞 𝟐𝟎𝟐𝟓. We are working on the matter and try to find a replacement.
Shown is one of the last images as an eye-catcher.
polarportal.bsky.social
First large melt event of the year in Greenland.
Melt area and percentage of total area in Greenland with melting on 24 June 2025, Polar Portal. There is melting over roughly 50% of the area.
polarportal.bsky.social
🌐❄️ 𝗧𝗵𝗲 𝗻𝗲𝘄 𝗣𝗼𝗹𝗮𝗿 𝗣𝗼𝗿𝘁𝗮𝗹 𝘄𝗲𝗯𝘀𝗶𝘁𝗲 𝗶𝘀 𝗹𝗶𝘃𝗲!
🔗https://polarportal.dk/en/

Here it is: the updated 𝗣𝗼𝗹𝗮𝗿𝗽𝗼𝗿𝘁𝗮𝗹.𝗱𝗸 – your gateway to 𝗿𝗲𝗮𝗹-𝘁𝗶𝗺𝗲 𝗱𝗮𝘁𝗮 𝗼𝗻 𝗔𝗿𝗰𝘁𝗶𝗰 𝘀𝗲𝗮 𝗶𝗰𝗲 𝗮𝗻𝗱 𝘁𝗵𝗲 𝗚𝗿𝗲𝗲𝗻𝗹𝗮𝗻𝗱 𝗜𝗰𝗲 𝗦𝗵𝗲𝗲𝘁.

The portal is powered by DMI, GEUS, DTU Space and DTU DTU Byg and supported by data from Asiaq and PROMICE.
The new Polar Portal start page
polarportal.bsky.social
The onset of the ablation season in Greenland is defined as the first of at least three days in a row with a surface mass balance below -1 km³ (= -1 gigaton). In 2025, this was on 15 June, 2 days later than the median 1981-2010.

Top: SMB, 17 June 2025
Bottom: sum of daily SMBs since 1 Sep 2024
A map and a line graph are shown with the ablation over Greenland in 2025. The onset of the ablation season in Greenland is defined as the first of at least three days in a row with a surface mass balance below -1 km³ (= -1 gigaton). In 2025, this was on 15 June, 2 days later than the median 1981-2010. Ice loss occurred mainly along the west coast.
polarportal.bsky.social
The onset of the melting season in Greenland is defined as the first of at least three days in a row with melting over more than 5% of the Greenland Ice Sheet. The median over the period 1981-2025 is on 26 May. This year, the melting onset was 12 days early, on 14 May, which is rank 11 of 45 years.
A map and a line graph are shown with the melt extent over Greenland in 2025. The onset of the melting season in Greenland is defined as the first of at least three days in a row with melting over more than 5% of the Greenland Ice Sheet. The median over the period 1981-2025 is on 26 May. This year, the melting onset was 12 days early, on 14 May, which is rank 11 of 45 years.
polarportal.bsky.social
Within the next weeks, we will introduce a facelifted @polarportal.bsky.social (bye bye 90s design!) and also some new data! You always find data from @dmidk.bsky.social and our colleagues from #GEUS and @dtucryo.bsky.social there. Glad to say data is available on this side of the Atlantic.
polarportal.bsky.social
After a brief slightly cooler period, high temperatures over the ice sheet again. Approaching the onset of the melting season.
Temperature anomalies from the average 2004-2013 for the period 4-8 April 2025.
polarportal.bsky.social
Accumulated surface mass balance (SMB) 1 Sep 2023 to 31 Aug 2024 was 367.3 Gt (=km³), close to the average 1980-2024. SMB is snowfall - runoff, i.e. always positive.
This is not the total mass balance TMB, which also includes iceberg calving. Greenland has lost ice every year since the mid-1990s.
The accumulated surface mass balance (SMB) for the "SMB year" 1 September 2023 to 31 August 2024 ended at 367.3 Gt (=km³), which is very close to the average 1980-2024.