Resul Umit
@resulumit.bsky.social
310 followers 120 following 32 posts
Political scientist. Associate professor in comparative politics, at Durham University. https://resulumit.com/
Posts Media Videos Starter Packs
resulumit.bsky.social
This is surprisingly hard to find! I ran into a similar problem last year and couldn’t find any straightforward OLS example for an introductory methods module, so I ended up writing up analysis myself using the BES data.
resulumit.bsky.social
Yes, Wikipedia is indeed an excellent resource for data on MPs across many countries, and it has been put to great use in projects such as the legislators dataset and package (github.com/saschagobel/...).

For our purposes, though, it is a bit less helpful when it comes to variables on candidates.
GitHub - saschagobel/legislatoR: Interface to the Comparative Legislators Database
Interface to the Comparative Legislators Database. Contribute to saschagobel/legislatoR development by creating an account on GitHub.
github.com
resulumit.bsky.social
Thanks to Chrome’s new OCR and Tabula, and a bit of elbow grease, we can now turn scanned return charges and campaign spending records like this into tidy data.

I’m beyond happy.
A scanned historical document titled 'Returns Relating to Election Charges', showing a table of candidates' names, expenses (in pounds, shillings, and pence) for agents, conveyances, advertising, and other costs, along with average cost per vote polled and number of votes received. The print is in small serif font, with some text faint or blurred due to poor scan quality.
resulumit.bsky.social
Indeed — voters seem to rely on different sources of information at different levels: this paper suggests that past elections have a particularly strong effect on expectations for constituency results, while opinion polls matter primarily for national-level expectations.

doi.org/10.1111/j.15...
How Do Voters Form Expectations about the Parties' Chances of Winning the Election?*
Objective. This article examines the factors that form voters' perceptions of the parties' chances of winning at both the national and the local levels. Method. We make use of the 1988 Canadian Ele....
doi.org
Reposted by Resul Umit
stathorizons.bsky.social
Join "Bluesky Data: Collection, Cleaning, and Analysis" with @resulumit.bsky.social on Aug. 26-27! Learn to access the #Bluesky API, clean social media data, and apply text & network analysis using #Rstats in this hands-on course.
Bluesky Data | Online Course | Code Horizons
This online seminar taught by Resul Umit, Ph.D., introduces collecting, preparing, and analyzing data from Bluesky in R.
codehorizons.com
resulumit.bsky.social
Thanks so much, Catherine! These are really helpful indeed.
resulumit.bsky.social
I've spent most of the day chasing citations for the claim that waiting for a service negatively affects evaluations of the provider.

Dozens and dozens of papers repeat it and cite a bunch of others --- but when you read the originals, there's no such evidence there at all.
resulumit.bsky.social
I don’t have a specific example, but I would start by looking at papers citing the "Boix–Miller–Rosato dichotomous coding of democracy" --- either the original article (doi.org/10.1177/0010...) or the updated dataset (doi.org/10.7910/DVN/...).

Unless I have misunderstood the question, of course.
resulumit.bsky.social
APSR has recently reintroduced its Research Notes track:

bsky.app/profile/apsr...
apsrjournal.bsky.social
📢 The APSR is opening a new Research Notes track!

Authors may now submit directly as Notes—or, with editor agreement, have papers reclassified during review. Notes should be ≤7,000 words (excl. refs/appendices).
resulumit.bsky.social
For elections since 1885, we plan to include a measure of constituency area (un)change, using data from @parlconst.bsky.social.

As for notional results, I'm unsure whether area change alone is informative enough to estimate past outcomes under new boundaries. Or is it? 🤔
resulumit.bsky.social
Currently, there are ten variables in the dataset.

What other candidate-level variables could we add, and from which sources?

Suggestions welcome!
A screenshot of R console output showing the names of variables in the dataset. It includes the following 10 variables: "election", "year", "date_start", "date_end", "constituency", "party", "candidate", "unopposed", "votes", and "turnout".
resulumit.bsky.social
I've received funding to improve my UK General Elections dataset (1832–2024)!

We will validate existing variables and add new ones — e.g. registered voters, campaign spending, candidate gender, IDs for matching with other datasets.

Current version:

doi.org/10.7910/DVN/...
resulumit.bsky.social
I've updated the Political Science Journals app to reflect this.

Curious to see which journals publish which formats, and at what lengths? Explore here:

🔗 resulumit.shinyapps.io/psjournals/
resulumit.bsky.social
Wikipedia has the exact date of birth for 372 MPs and approximate dates for 83 more. I’ve compiled this into a file and will email it to you in case it’s helpful, even if incomplete.
resulumit.bsky.social
Non-EU member states show some of the most striking shifts in public opinion on EU membership.

In a hypothetical referendum on whether their country should join or remain outside the EU, support for joining has noticeably increased over time in most surveyed countries.
Line charts showing support for joining vs. remaining outside the EU in hypothetical referendums for non-EU countries (Iceland, Montenegro, Norway, Serbia, Switzerland). Green lines (join) rise in some countries, while red lines (remain outside) decline. Data from ESS.
resulumit.bsky.social
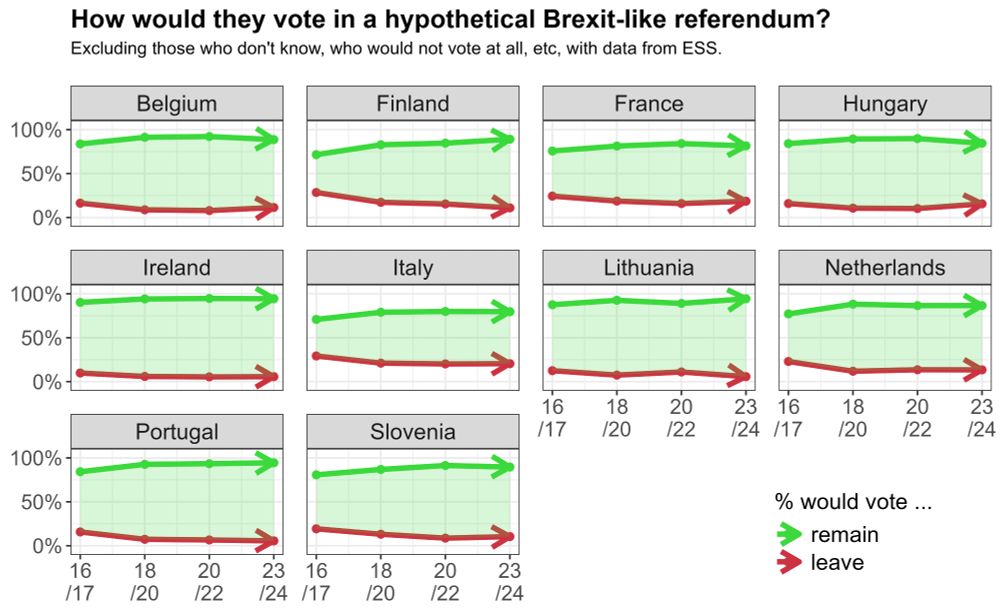
How would people vote if there were a Brexit-like referendum in their country?

Support for EU membership remains strong across the EU and, if anything, has been increasing in many countries since the Brexit referendum.
A grid of line plots showing support for EU membership ("remain") and leaving the EU ("leave") in hypothetical referendums across 10 EU countries. Green lines indicate support for remaining, consistently higher than red lines for leaving, with green increasing slightly over time in most cases. Data from ESS.
resulumit.bsky.social
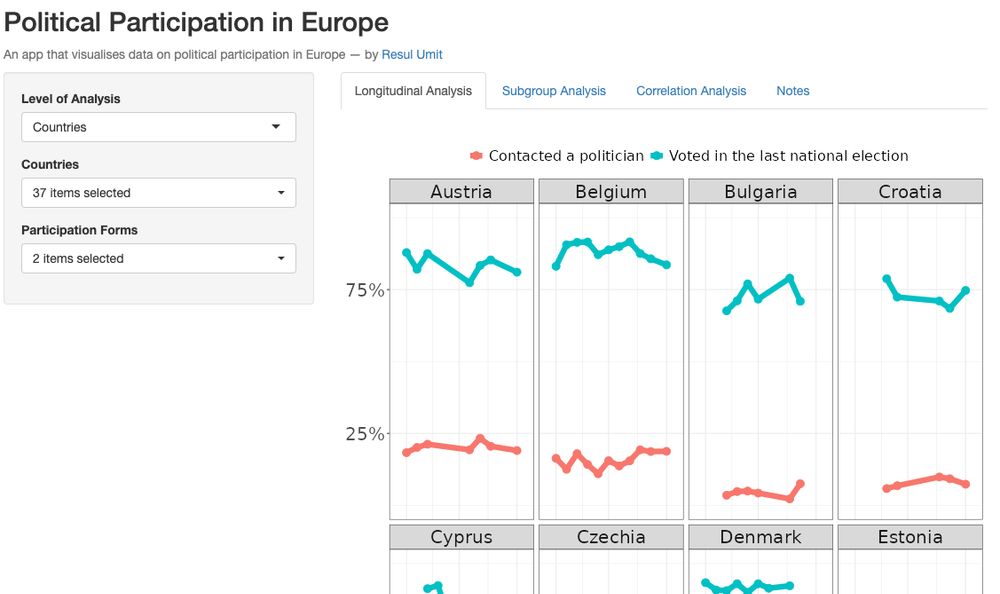
I’ve updated my Shiny app on political participation with the latest ESS data released yesterday.

I use this app for teaching, to help students explore and analyse patterns of political participation.

resulumit.shinyapps.io/participation/

#rstats
A screenshot of an interactive web application titled "Political Participation in Europe." The interface allows users to visualise data on political participation. The left panel includes dropdown menus, with "Level of Analysis" set to Europe and "Participation Forms" allowing multiple selections. Two options, "Attended a demonstration" and "Boycotted a product," are selected from the dropdown list. A longitudinal line chart on the right visualises trends for these two forms of participation from 2002 to 2023. The red line represents "Boycotted a product," and the blue line represents "Attended a demonstration." The y-axis ranges from 0% to 75%, and tabs at the top provide options for "Longitudinal Analysis" (currently selected), "Subgroup Analysis," "Correlation Analysis," and "Notes." A screenshot, showing the "Subgroup Analysis" tab. The analysis is set to "Regions," with four regions selected, focusing on university students or graduates who voted in the last national election in 2023. The visualisation displays bar charts comparing participation across Central and Eastern Europe, Northern Europe, Southern Europe, and Western Europe. A screenshot of the "Correlation Analysis" tab. The scatter plot visualises the relationship between "Contacted a politician" (x-axis) and "Voted in the last national election" (y-axis) at the European level for the year 2023. A regression line is included, with data points scattered around it, showing a positive correlation. The x-axis ranges from 0% to 20%, and the y-axis ranges from 0% to 100%. Selection options for variables and year are displayed in the left panel. Another screenshot of the "Longitudinal Analysis" tab, this time the analysis focuses on countries, with 37 countries selected and two participation forms: "Contacted a politician" (red) and "Voted in the last national election" (blue). The visualisation includes small multiple line charts for each country, such as Austria, Belgium, Bulgaria, and Croatia, showing trends over time for the selected participation forms. The y-axis ranges from 0% to 75%.
resulumit.bsky.social
Thank you! You're absolutely right that not everyone needs a visitor visa to travel to Canada for a conference, and one should check.

My post was about those who would need one, like myself.
resulumit.bsky.social
Are you planning to propose a paper for #APSA2025, and you would need a visa to travel to Canada?

Do check the visa processing times first. As of now, the processing time for a visitor visa application from the UK is 398 days!

www.canada.ca/en/immigrati...
Check processing times - Canada.ca
Check application processing times – Immigration and citizenship
www.canada.ca
resulumit.bsky.social
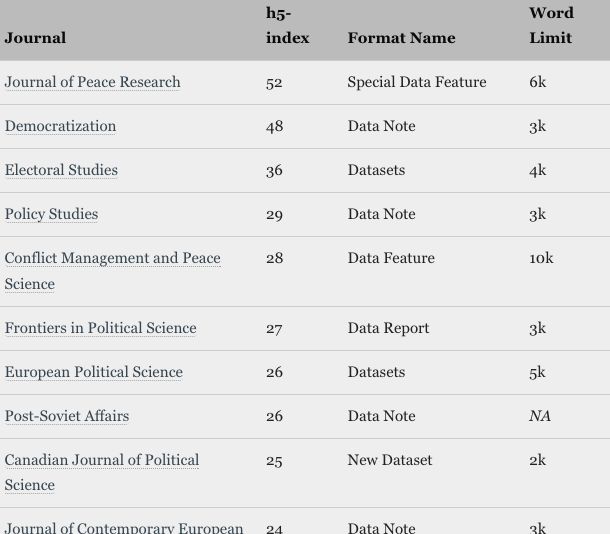
Do you have a dataset that the political science community should know and use?

At least 18 journals in the discipline now offer a dedicated article category for sharing datasets. Find out more on my blog:

resulumit.com/blog/polisci...
The table lists political science journals that accept data-focused articles. It includes columns for the journal name, h5-index, format name, and word limit for submissions. It's a screenshot from the linked webpage.
resulumit.bsky.social
Seven political science journals now offer a dedicated category for replication studies! Each of these journals accepts replications of articles published both within their own journal and in other relevant journals.

resulumit.com/blog/polisci...
Table listing political science journals that publish replication studies. Columns include Journal, h5-index, Format Name, and Length Limit. Journals listed are: American Political Science Review (h5-index 82, no length limit), Public Administration (h5-index 47, no length limit), Political Communication (h5-index 46, 30-page limit), Political Science Research and Methods (h5-index 44, no length limit), Research & Politics (h5-index 29, 2,000-word limit), Canadian Journal of Political Science (h5-index 25, 2,000-word limit), and Journal of Experimental Political Science (h5-index 25, 3,000-word limit).
resulumit.bsky.social
With the chatter yesterday about a possible third Trump term, I looked at data on how often sitting incumbents around the world have extended their term or eligiblity to run.

Cases have become more common since about 2000, though this coincides with a general rise in executive elections globally.
A bar chart titled "Has the incumbent extended their term or eligibility to run?" The x-axis represents years, ranging from before 1960 to after 2020. The y-axis shows the count of occurrences, reaching up to about 25. Bars are stacked and colour-coded: yellow represents "No," indicating cases where incumbents did not extend their terms, while dark green represents "Yes," showing instances where incumbents extended their terms or eligibility. Over time, the yellow bars dominate, suggesting more elections without term extension, but green segments are visible, especially towards the later years. At the bottom right, a caption reads "Data: nelda.co | Graph: Resul Umit."
resulumit.bsky.social
Thank you very much for reporting this.

It seems a last-minute change in code affected that filter without me realising. I’ve now resolved the issue, and the updated version is live.
resulumit.bsky.social
Looking for the right political science journal for your next paper? 📄✨

I've updated my app with new data and functionality to help you navigate over 300 journals by scope, article types, and more.

resulumit.shinyapps.io/psjournals/
Screenshot of a web app titled 'Political Science Journals' by Resul Umit, designed to filter data on political science journals. The interface includes several filtering options on the left, such as 'Journal scope' (a text field), 'Publishing since' (slider from 1837 to 2024), 'Publisher' (dropdown menu with selected items), 'Impact Factor' (slider from 0 to 10), 'H5 Index' and 'H5 Median' (both with sliders from 0 to 119 and 0 to 220, respectively). There is also an option to 'Include journals with unknown metrics', a dropdown for 'Article type' (with 8 items selected), and a field for 'Length limits' with a unit selection of 'Words'.