Richard Patterson
@richpatter.bsky.social
26 followers 49 following 16 posts
Public health scientist.
Posts Media Videos Starter Packs
Reposted by Richard Patterson
eleanorwinpenny.bsky.social
Interested in a PhD in 'Social Inequalities and Adolescent Health Behaviours' (for Oct 2026)? See here for a PhD jointly supervised with Prof Jessica Barrett, MRC Biostatistics Unit, University of Cambridge www.cam-dtp.ac.uk/students/cur... 🛟🧪@socsocmed.bsky.social
2026 Studentship Opportunities - CAM-DTP
www.cam-dtp.ac.uk
richpatter.bsky.social
Or study the health and activity impacts of evolving cities with @jennapanter.bsky.social and I.
richpatter.bsky.social
Rethink evidence synthesis for public health with @dbogilvie.bsky.social, @jeanmadams.bsky.social, and Miriam Alvarado.
richpatter.bsky.social
Conduct research on urban form, behaviour & health in Singapore with Lou Foley and @thomasburgoine.bsky.social.
Reposted by Richard Patterson
mrcepid.bsky.social
New research by Caroline Kienast-von-Einam et al. into changes in cycling behavior following residential relocation, finds most participants didn't base relocation decisions on cycling intentions, and physical and social changes were far more important in shaping cycling behaviour.

buff.ly/EalRoo1
Reposted by Richard Patterson
mrcepid.bsky.social
Health & Place paper by Richard Patterson and colleagues examines the cross-sectional and longitudinal associations of residential neighbourhood walkability and takeaway food availability with markers of adiposity separately and combined.

Read at buff.ly/XY8Hrqg
Reposted by Richard Patterson
dbogilvie.bsky.social
This webinar will introduce the updated MRC/NIHR framework for the conduct and use of natural experimental evaluations.

Fri 23 May, 1200 to 1315 BST

Register here: events.teams.microsoft.com/event/f01e66...
Reposted by Richard Patterson
johnholbein1.bsky.social
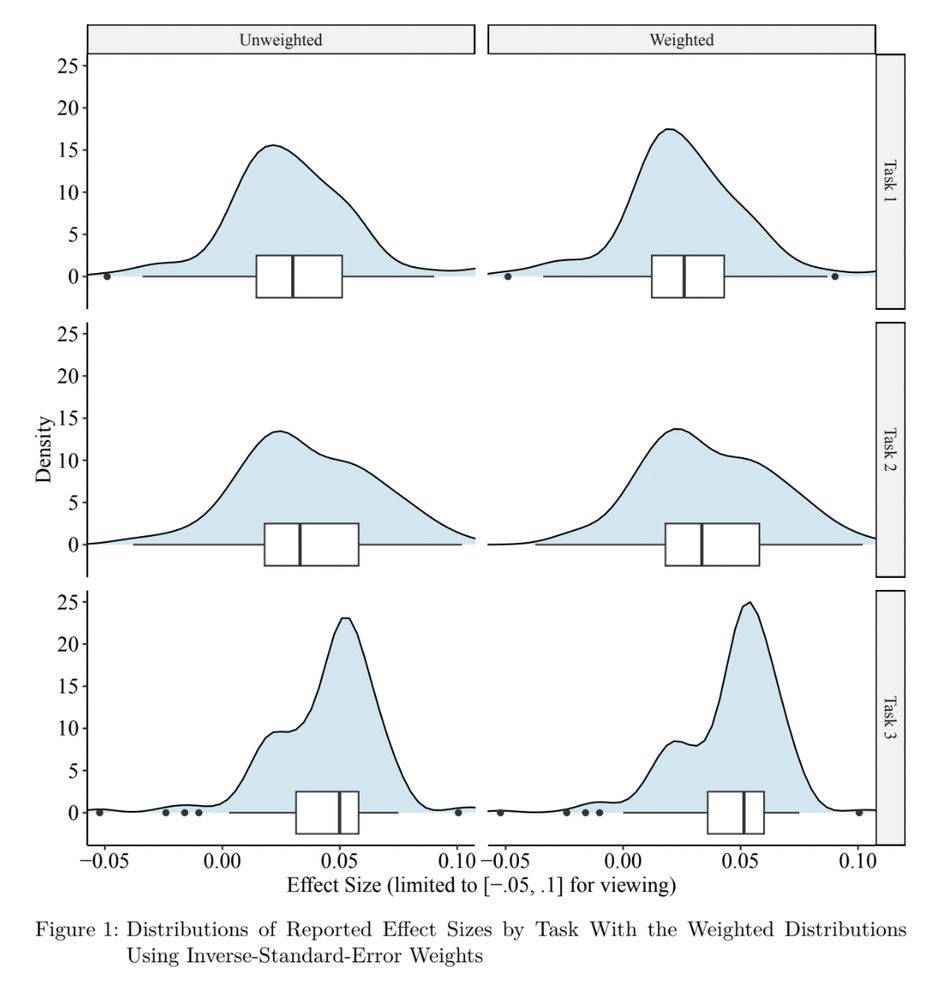
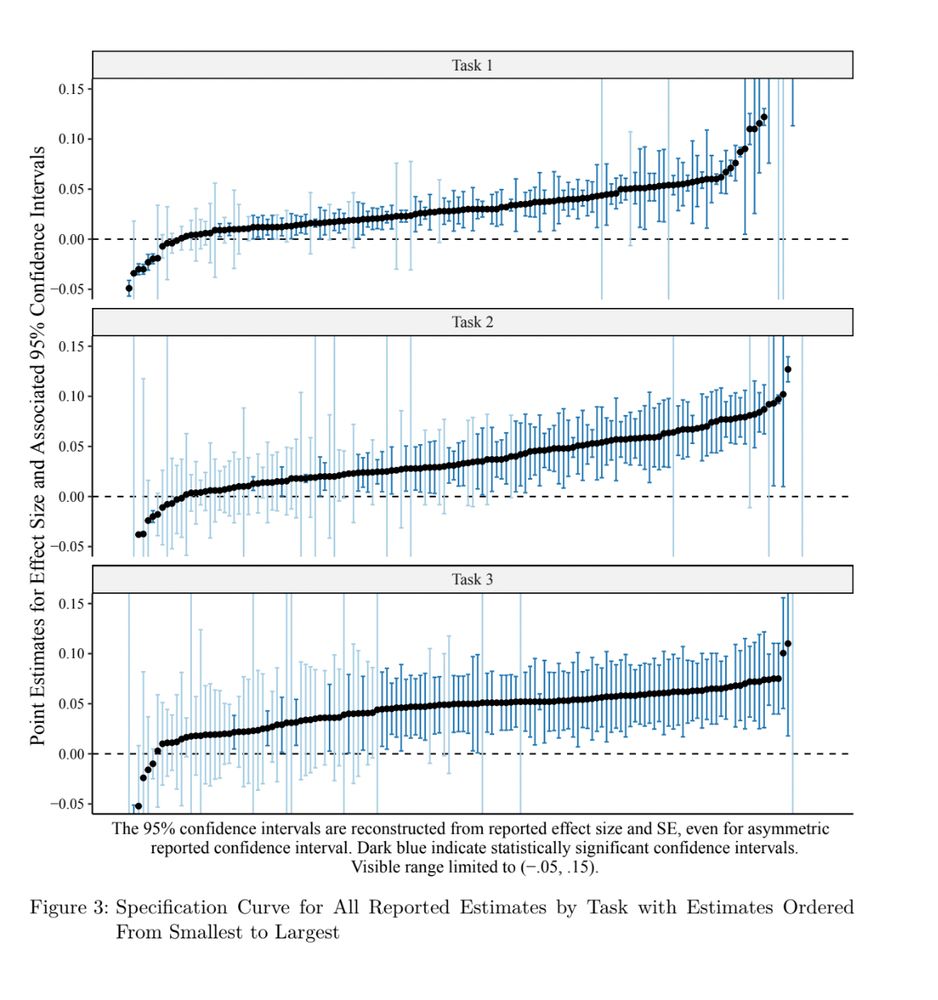
You've heard of the many analysts projects, right?

Scholars give the same dataset/question to a bunch of researchers & they still get different answers.

Why is that?

Data cleaning!

This is consistent with Gelman's "garden of forking paths." Small coding decisions often drive results.
Reposted by Richard Patterson
richpatter.bsky.social
The FT piece? You should have access through the library www.libraries.cam.ac.uk/eresources/n...
richpatter.bsky.social
Perhaps predictably, those with occupations involving heavy manual labour saw a reduction in physical activity over retirement.
richpatter.bsky.social
This reminds me of Leonie Glasson's study of physical activity changes at retirement (at the other end of the working life). She found that physical activity increased when people retired, primarily driven by those retiring from sedentary or standing occupations. doi.org/10.1016/j.yp...
Redirecting
doi.org
Reposted by Richard Patterson
jhoenink.bsky.social
🚨 New Research Alert! 🚨
In our latest study we found that:
🍔 Online food delivery services (OFDS) use increased from 16% to 25% in just three years.
🏠 The impact of physical food outlets on out-of-home meal consumption is weakening as OFDS availability grows.
Physical and online food outlet availability and its influence on out-of-home dietary behaviours in Great Britain: A repeated cross-sectional study
As online food delivery service (OFDS) platforms gain popularity, understanding their impact on diet alongside physical food outlets is important for …
www.sciencedirect.com
richpatter.bsky.social
The dry stone wall metaphor for systematic reviewing.

"Whereas the conventional systematic reviewer’s task is statistical (to summarise data), the dry stone wall reviewer’s task is interpretive (to make sense of those data)."
trishgreenhalgh.bsky.social
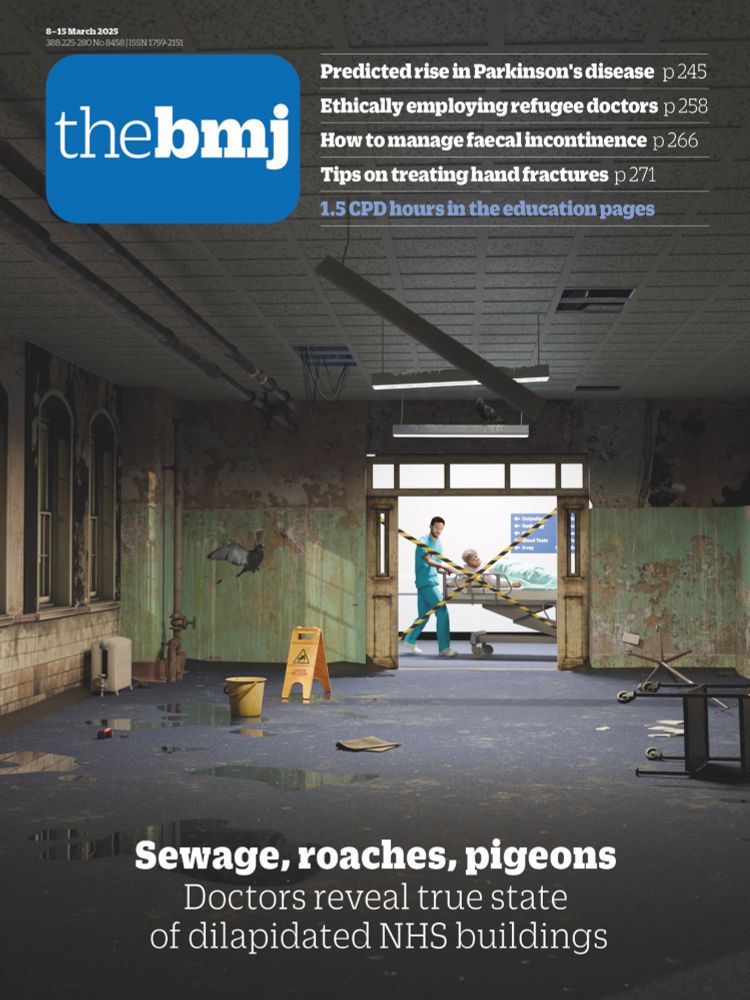
In the excitement over our new review of PAs, I forgot to tell you about the OTHER paper published in BMJ today, my commentary on the challenges of doing systematic reviews of evidence when there's no RCTs and most of the primary studies were unique and non-standardised.🧪
www.bmj.com/content/388/...
Systematic reviews of non-RCT evidence: building dry stone walls
To bake good cookies, start with good cookie dough. To use a different metaphor, to build a brick wall, take a large collection of bricks—all the same size and in perfect shape—and line them up neatly...
www.bmj.com
richpatter.bsky.social
Higher walkability was associated with more takeaway availability. This is presumably because both are more likely in more dense/urban areas.
richpatter.bsky.social
Interestingly, we found that accounting for walkability in analyses of takeaways and vice versa led to more consistent findings. This suggests the importance of accounting for multiple aspects of the environment that are relevant to the same outcome and are highly related to one another.
richpatter.bsky.social
Living in more walkable neighbourhoods with lower availability of takeaway food outlets is associated with lower adiposity and improved trends over time.

authors.elsevier.com/sd/article/S...
ScienceDirect.com | Science, health and medical journals, full text articles and books.
authors.elsevier.com
Reposted by Richard Patterson
jeanmadams.bsky.social
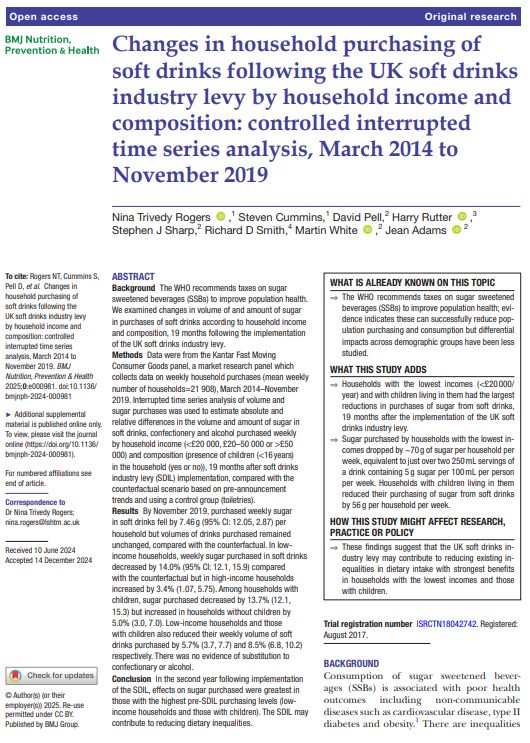
ICYMI: Our new paper on the impact of the UK Soft Drinks Industry Levy is out. 19 months after implementation, we found that households purchased 7.5g less sugar from soft drinks compared to expected - equivalent to a 2.6% reduction. nutrition.bmj.com/content/earl...
Background The WHO recommends taxes on sugar sweetened beverages (SSBs) to improve population health. We examined changes in volume of and amount of sugar in purchases of soft drinks according to household income and composition, 19 months following the implementation of the UK soft drinks industry levy.

Methods Data were from the Kantar Fast Moving Consumer Goods panel, a market research panel which collects data on weekly household purchases (mean weekly number of households=21 908), March 2014–November 2019. Interrupted time series analysis of volume and sugar purchases was used to estimate absolute and relative differences in the volume and amount of sugar in soft drinks, confectionery and alcohol purchased weekly by household income (<£20 000, £20–50 000 or >£50 000) and composition (presence of children (<16 years) in the household (yes or no)), 19 months after soft drinks industry levy (SDIL) implementation, compared with the counterfactual scenario based on pre-announcement trends and using a control group (toiletries).

Results By November 2019, purchased weekly sugar in soft drinks fell by 7.46 g (95% CI: 12.05, 2.87) per household but volumes of drinks purchased remained unchanged, compared with the counterfactual. In low-income households, weekly sugar purchased in soft drinks decreased by 14.0% (95% CI: 12.1, 15.9) compared with the counterfactual but in high-income households increased by 3.4% (1.07, 5.75). Among households with children, sugar purchased decreased by 13.7% (12.1, 15.3) but increased in households without children by 5.0% (3.0, 7.0). Low-income households and those with children also reduced their weekly volume of soft drinks purchased by 5.7% (3.7, 7.7) and 8.5% (6.8, 10.2) respectively. There was no evidence of substitution to confectionary or alcohol.

Conclusion In the second year following implementation of the SDIL, effects on sugar purchased were greatest in those with the highest pre-SDIL purchasing levels (low-income household…
Reposted by Richard Patterson