Ryan O'Donnell
@rodonnell.bsky.social
1.5K followers 130 following 50 posts
interim executive director @dataforprogress.org | used to be with barack obama aoc jamaal bowman seiu etc | the dog is newman | he/him https://linktr.ee/rodonnell
Posts Media Videos Starter Packs
Reposted by Ryan O'Donnell
zeteo.com
Zeteo @zeteo.com · Aug 7
“Voters across party lines oppose Israel blocking food & medical aid in Gaza, & want Trump to demand that Israel let aid into Gaza.”

@rodonnell.bsky.social, interim executive director of @dataforprogress.org, writes about American voters growing critical of Israel.

Read: zeteo.com/p/poll-ameri...
rodonnell.bsky.social
How much attention do you pay to news about national politics on TV, radio, newspapers, or the Internet?

<> A great deal <> A lot <> A moderate amount <> A little <> None at all
rodonnell.bsky.social
surprise! we too find the republican budget bill is *incredibly unpopular* — truly wild to watch so many house republicans willing to torch their own seats for trump’s ego, all while stripping their constituents of health coverage to fund tax cuts for billionaires
dataforprogress.org
After reading a description of the bill, voters oppose it by a -19-point margin.

www.dataforprogress.org/blog/2025/7/...
Bar chart of polling data from Data For Progress.
Title: A Majority of Voters Oppose the Republican Budget Bill.
Description: Lawmakers in Congress are proposing a tax and spending bill. It would: Extend tax cuts for all individuals and corporations, with most of these benefiting high-income households Remove taxes on tips and overtime pay, and increase the Child Tax Credit by $500 per child for most families Cut over $700 billion from Medicaid and $300 billion from Affordable Care Act subsidies Cut over $300 billion from the Supplemental Nutrition Assistance Program (SNAP, or food assistance) Increase military and border security spending by more than $200 billion in total Add about $3 trillion dollars to the national debt Do you support or oppose this proposal?
All likely voters — Support: 38%, Oppose: 57%
Democrat — Support: 12%, Oppose: 84%
Independent / Third party — Support: 37%, Oppose: 55%
Republican — Support: 65%, Oppose: 30%
Persuadable voter — Support: 28%, Oppose: 65%
Reposted by Ryan O'Donnell
rodonnell.bsky.social
any world turnout could get added to your sheet? 😇 it's so helpful already but turnout as a % of 2024 votes or something would be even more helpful
rodonnell.bsky.social
this is a good one imo! bsky.app/profile/data...
dataforprogress.org
In late March, there was no consensus about what news story people were hearing most.

Trump's recent sweeping tariff announcement changed that — this is what it looks like when a news story truly breaks through.
Time series chart of polling data from Data For Progress.
Title: Sharp Increase in Voters Hearing About Tariffs.
Description: Open-ended question: In the past week, what's the one specific news story you heard, saw, or read about the most?

Tariffs — Increased, with the highest response reported on Apr 08, 2025 (47%) and the lowest response recorded on Mar 26, 2025 (16%).
National security leak — Decreased, with the highest response reported on Mar 26, 2025 (16%) and the lowest response recorded on Apr 08, 2025 (1%).
DOGE / cuts to Social Security and other benefits / Elon Musk — Decreased, with the highest response reported on Mar 26, 2025 (8%) and the lowest response recorded on Apr 08, 2025 (5%).
Read full piece at: https://www.dataforprogress.org/insights/2025/4/11/our-polling-measured-what-broke-through-and-it-was-tariffs
rodonnell.bsky.social
this question also helps contextualize what "governing style" people want
rodonnell.bsky.social
lots of good stuff in the new poll with zeteo — we also ran a conjoint test (iykyk) and the most favored profile for the 2028 dem nominee: a 47-year-old Black woman who’s governed a state and is an economic populist. if only this person existed
rodonnell.bsky.social
we also tested favorables for a wide range of democrats — obama has the highest fav at 92%. fetterman has the highest unfav at 36%
rodonnell.bsky.social
we tested a whole lot of names for the 2028 democratic primary with zeteo — considering vs not considering tells you way more than an early ballot test: cory booker currently leads at +68. stephen a smith finishes last at -18
rodonnell.bsky.social
i was surprised when we asked voters what news story stood out most during peak “signalgate” coverage — at best, it was tied with tariffs and losing to “nothing”

this week, though, trump’s tariffs were overwhelmingly the top story
dataforprogress.org
In late March, there was no consensus about what news story people were hearing most.

Trump's recent sweeping tariff announcement changed that — this is what it looks like when a news story truly breaks through.
Time series chart of polling data from Data For Progress.
Title: Sharp Increase in Voters Hearing About Tariffs.
Description: Open-ended question: In the past week, what's the one specific news story you heard, saw, or read about the most?

Tariffs — Increased, with the highest response reported on Apr 08, 2025 (47%) and the lowest response recorded on Mar 26, 2025 (16%).
National security leak — Decreased, with the highest response reported on Mar 26, 2025 (16%) and the lowest response recorded on Apr 08, 2025 (1%).
DOGE / cuts to Social Security and other benefits / Elon Musk — Decreased, with the highest response reported on Mar 26, 2025 (8%) and the lowest response recorded on Apr 08, 2025 (5%).
Read full piece at: https://www.dataforprogress.org/insights/2025/4/11/our-polling-measured-what-broke-through-and-it-was-tariffs
rodonnell.bsky.social
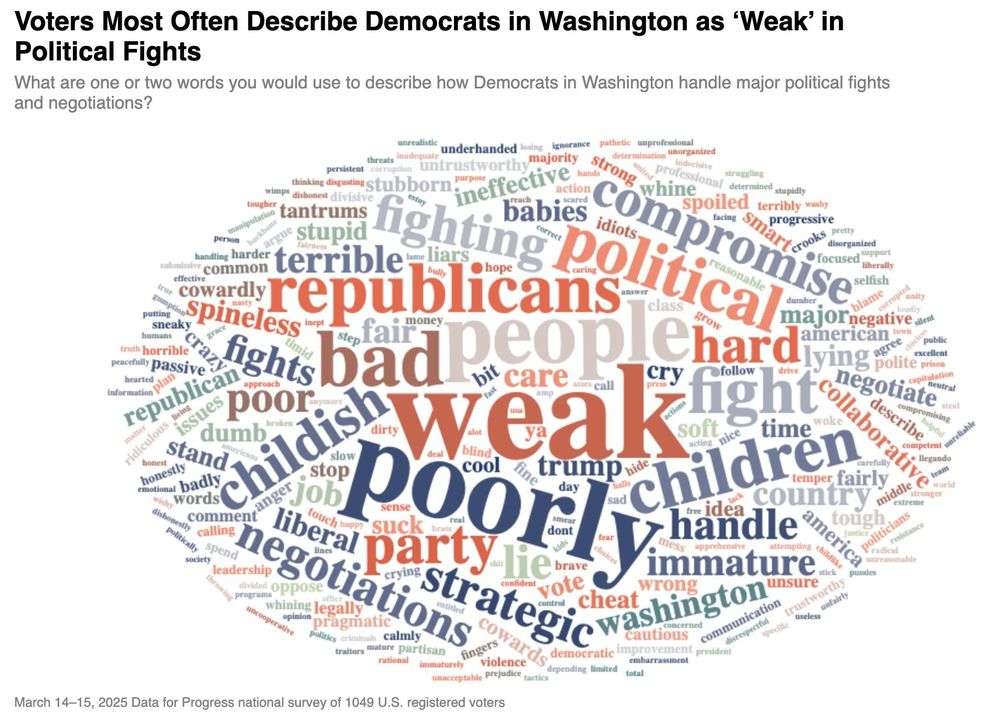
after the shutdown vote, we asked voters how democrats in washington handle political fights. the most common response? "weak"
rodonnell.bsky.social
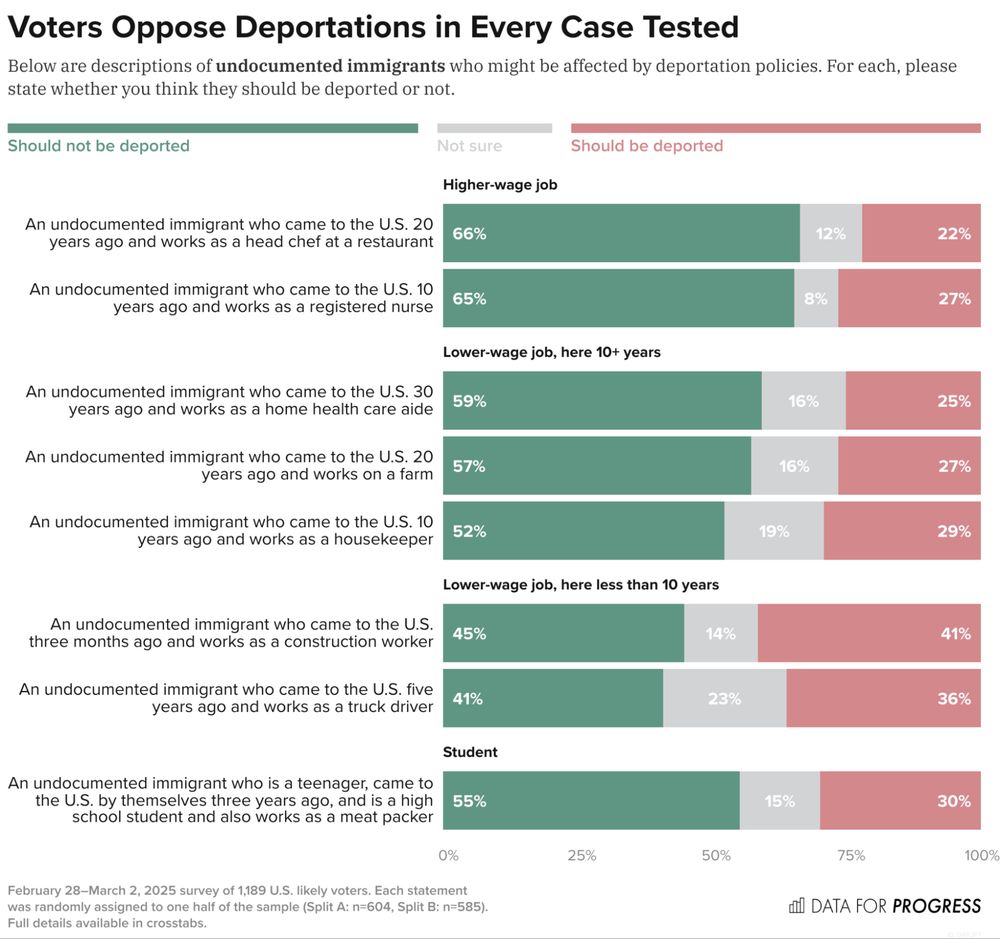
voters often say they support mass deportations in theory—until they have to think about the actual people being deported. our research keeps proving it: cruelty only polls well in the abstract. make it real, and support crumbles
dataforprogress.org
NEW: Voters oppose deportations of various undocumented immigrants — including those who have lower-wage jobs and a shorter length of stay in the U.S. — when presented with real-world case examples.
Bar chart of polling data from Data For Progress.
Title: Voters Oppose Deportations in Every Case Tested.
Description: Below are descriptions of undocumented immigrants who might be affected by deportation policies. For each, please state whether you think they should be deported or not.
An undocumented immigrant who came to the U.S. 20 years ago and works as a head chef at a restaurant — Should not be deported: 66%, Not sure: 12%, Should be deported: 22%
An undocumented immigrant who came to the U.S. 10 years ago and works as a registered nurse — Should not be deported: 65%, Not sure: 8%, Should be deported: 27%
An undocumented immigrant who came to the U.S. 30 years ago and works as a home health care aide — Should not be deported: 59%, Not sure: 16%, Should be deported: 25%

See full results at: https://www.dataforprogress.org/blog/2025/3/12/voters-oppose-deportations-of-undocumented-immigrants-regardless-of-their-job-or-years-in-the-us
rodonnell.bsky.social
one funny thing about being part of an openly progressive polling outfit: plenty of center/right folks assume every poll we release skews left. but bad data isn’t just wrong—it’s useless. cooking numbers would hurt the movement, not help it
rodonnell.bsky.social
new @dataforprogress.org data confirms what you’ve always felt: democrats criticize their own party way more than republicans do
rodonnell.bsky.social
most voters have a sense of what oligarchy means — and it’s probably good bernie is helping teach the rest, since a plurality thinks we're becoming one
dataforprogress.org
NEW: After learning the definition of oligarchy, 67% of Democrats and 61% of Independents say the U.S. is becoming more oligarchic.

www.dataforprogress.org/blog/2025/3/...
Bar chart of polling data from Data For Progress.
Title: Democrats and Independents Say the U.S. Is Moving Toward an Oligarchy.
Description: Which of the following do you think best describes the direction the United States is headed?
All likely voters — Moving toward an oligarchy: 48%, Staying as it is today: 17%, Moving toward a more democratic system: 25%, Don't know: 10%
Democrat — Moving toward an oligarchy: 67%, Staying as it is today: 11%, Moving toward a more democratic system: 15%, Don't know: 7%
Independent / Third party — Moving toward an oligarchy: 61%, Staying as it is today: 14%, Moving toward a more democratic system: 14%, Don't know: 11%
Republican — Moving toward an oligarchy: 23%, Staying as it is today: 24%, Moving toward a more democratic system: 41%, Don't know: 12%

February 28–March 2, 2025 survey of 1,189 likely voters.
rodonnell.bsky.social
whenever you highlight real people affected by trump's immigration policies, voters consistently choose compassion over cruelty
Reposted by Ryan O'Donnell
dataforprogress.org
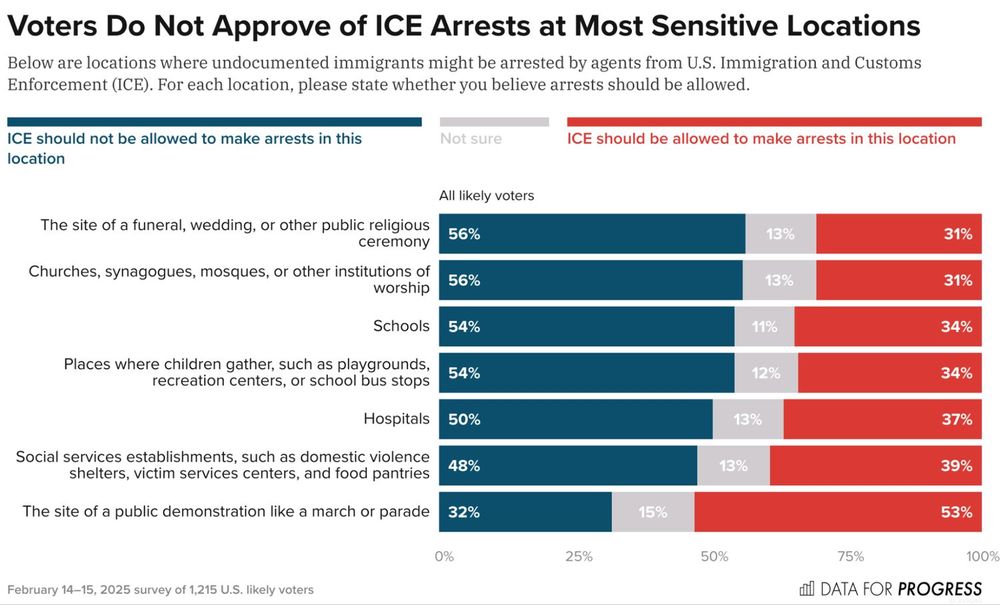
NEW: When asked about the nuances of immigration policy, voters prefer more humane approaches.

For example, a majority of voters think ICE should not be allowed to make arrests at sensitive locations like schools and churches.

www.dataforprogress.org/blog/2025/2/...
Bar chart of polling data from Data For Progress.
Title: Voters Do Not Approve of ICE Arrests at Most Sensitive Locations.
Description: Below are locations where undocumented immigrants might be arrested by agents from U.S. Immigration and Customs Enforcement (ICE). For each location, please state whether you believe arrests should be allowed.
The site of a funeral, wedding, or other public religious ceremony — ICE should not be allowed to make arrests in this location: 56%, Not sure: 13%, ICE should be allowed to make arrests in this location: 31%
Churches, synagogues, mosques, or other institutions of worship — ICE should not be allowed to make arrests in this location: 56%, Not sure: 13%, ICE should be allowed to make arrests in this location: 31%
Schools — ICE should not be allowed to make arrests in this location: 54%, Not sure: 11%, ICE should be allowed to make arrests in this location: 34%
Places where children gather, such as playgrounds, recreation centers, or school bus stops — ICE should not be allowed to make arrests in this location: 54%, Not sure: 12%, ICE should be allowed to make arrests in this location: 34%
Hospitals — ICE should not be allowed to make arrests in this location: 50%, Not sure: 13%, ICE should be allowed to make arrests in this location: 37%
Social services establishments, such as domestic violence shelters, victim services centers, and food pantries — ICE should not be allowed to make arrests in this location: 48%, Not sure: 13%, ICE should be allowed to make arrests in this location: 39%
The site of a public demonstration like a march or parade — ICE should not be allowed to make arrests in this location: 32%, Not sure: 15%, ICE should be allowed to make arrests in this location: 53%

February 14–15, 2025 survey of 1,215 U.S. likely voters.
Reposted by Ryan O'Donnell
dataforprogress.org
NEW: Forty-five percent of voters say that Elon Musk has made them less likely to buy a Tesla, while only 17% say that they are more likely to purchase one.

www.dataforprogress.org/datasets/pol...
Bar chart of polling data from Data For Progress.
Title: Democrats and Independents Say Elon Musk Has Made Them Less Likely to Buy a Tesla.
Description: Has Elon Musk made you more or less likely to buy or lease a Tesla?
All likely voters — More likely: 17%, Less likely: 45%
Democrat — More likely: 13%, Less likely: 66%
Independent / Third party — More likely: 12%, Less likely: 50%
Republican — More likely: 23%, Less likely: 21%

February 14–15, 2025 survey of 1,215 likely voters.
Reposted by Ryan O'Donnell
dataforprogress.org
NEW: A majority of Democratic voters (65%), and an even larger majority of Independents who lean Democratic (80%), say the party is not doing enough and needs to fight harder against the Trump administration.

www.dataforprogress.org/datasets/pol...
Bar chart of polling data from Data For Progress.
Title: Democrats and Independents Who Lean Democratic Want the Party to Fight Harder Against Trump.
Description: Which of the following comes closest to your view, even if neither is exactly right?
Response Options:
A) The Democratic Party is not doing enough to stand up to Donald Trump and his administration and needs to fight harder.
B) Don't know
C) The Democratic Party could do a better job resisting Donald Trump and his administration, but overall is doing a decent job.
All likely voters — 67% chose A, 4% chose B, 29% chose C
Democrat — 65% chose A, 4% chose B, 31% chose C
Democratic-leaning Independent — 80% chose A, 4% chose B, 16% chose C

February 8–9, 2025 survey of 542 likely Democratic voters and Independent voters who lean towards Democrats.
Reposted by Ryan O'Donnell
rodonnell.bsky.social
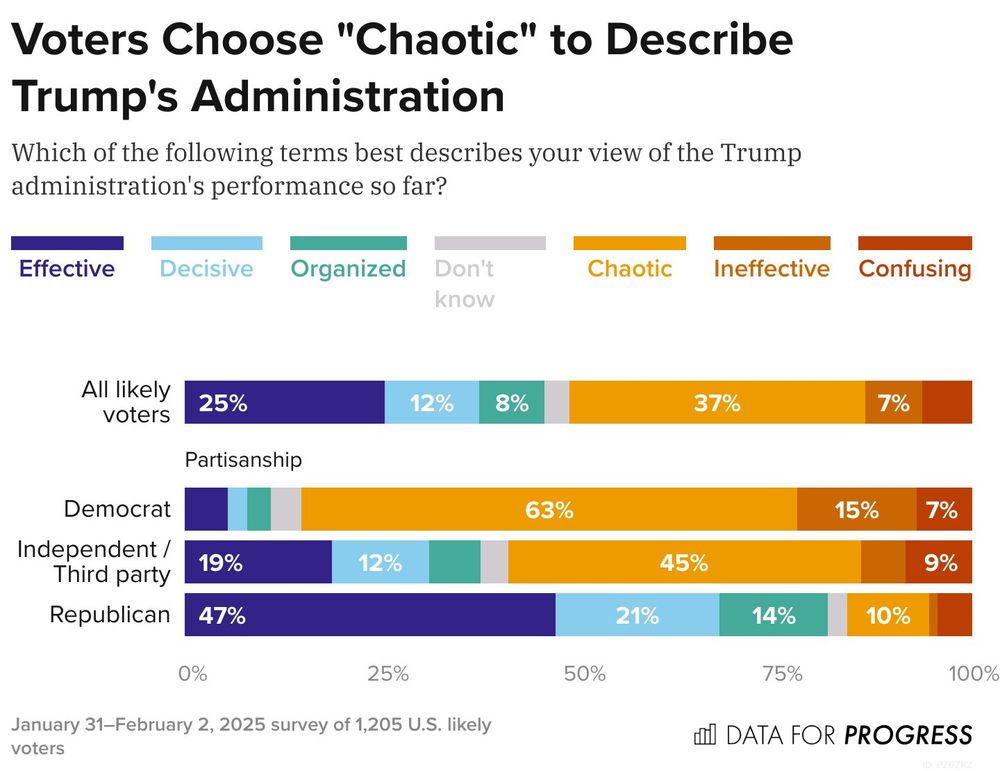
a plurality of independents say trump's admin is "chaotic" (45%) — with "effective" a distant second at 19%
dataforprogress.org
NEW: When given a list of terms to describe Trump's administration so far, a plurality of voters select "chaotic."

www.dataforprogress.org/blog/2025/2/...
Bar chart of polling data from Data For Progress.
Title: Voters Choose "Chaotic" to Describe Trump's Administration.
Description: Which of the following terms best describes your view of the Trump administration's performance so far?
All likely voters — Effective: 25%, Decisive: 12%, Organized: 8%, Don't know: 3%, Chaotic: 37%, Ineffective: 7%, Confusing: 6%
Democrat — Effective: 5%, Decisive: 2%, Organized: 3%, Don't know: 4%, Chaotic: 63%, Ineffective: 15%, Confusing: 7%
Independent / Third party — Effective: 19%, Decisive: 12%, Organized: 7%, Don't know: 3%, Chaotic: 45%, Ineffective: 6%, Confusing: 9%
Republican — Effective: 47%, Decisive: 21%, Organized: 14%, Don't know: 2%, Chaotic: 10%, Ineffective: 1%, Confusing: 4%

January 31–February 2, 2025 survey of 1,205 U.S. likely voters.
rodonnell.bsky.social
the only thing worse for eric adams than being under indictment during the nyc democratic primary is getting bailed out by donald trump’s justice department
rodonnell.bsky.social
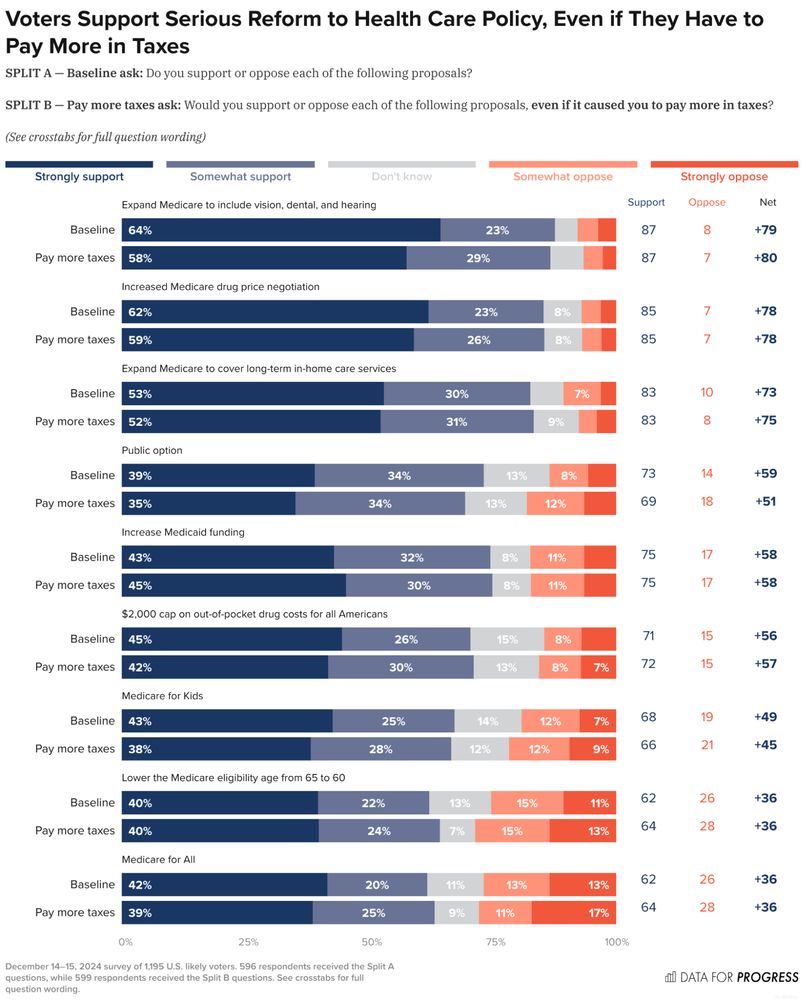
feels like we’re going to be using this chart a lot
Reposted by Ryan O'Donnell
dataforprogress.org
NEW: Voters strongly support major health care reforms, from expanding Medicare and Medicaid to a public option and Medicare for All — and they remain supportive even after being told they’d pay more in taxes.

www.dataforprogress.org/datasets/sup...
Bar chart of polling data from Data For Progress.
Title: Voters Support Serious Reform to Health Care Policy, Even if They Have to Pay More in Taxes.

Read the full poll at: https://www.dataforprogress.org/datasets/support-for-health-care-reforms