


Rust Never Sleeps / George Morrison🇨🇦
@rustneversleeps.bsky.social
Investment pro here for
• climate science, economics, solutions, policy, investment, impacts
• energy transition
• economics
Big on domain experts/expertise, abundance, potential.
*V* anti- fake experts, poseurs, snark, *esp.* climate-related.
• climate science, economics, solutions, policy, investment, impacts
• energy transition
• economics
Big on domain experts/expertise, abundance, potential.
*V* anti- fake experts, poseurs, snark, *esp.* climate-related.
yes, agree... @kenrice.bsky.social, @sarava.net?
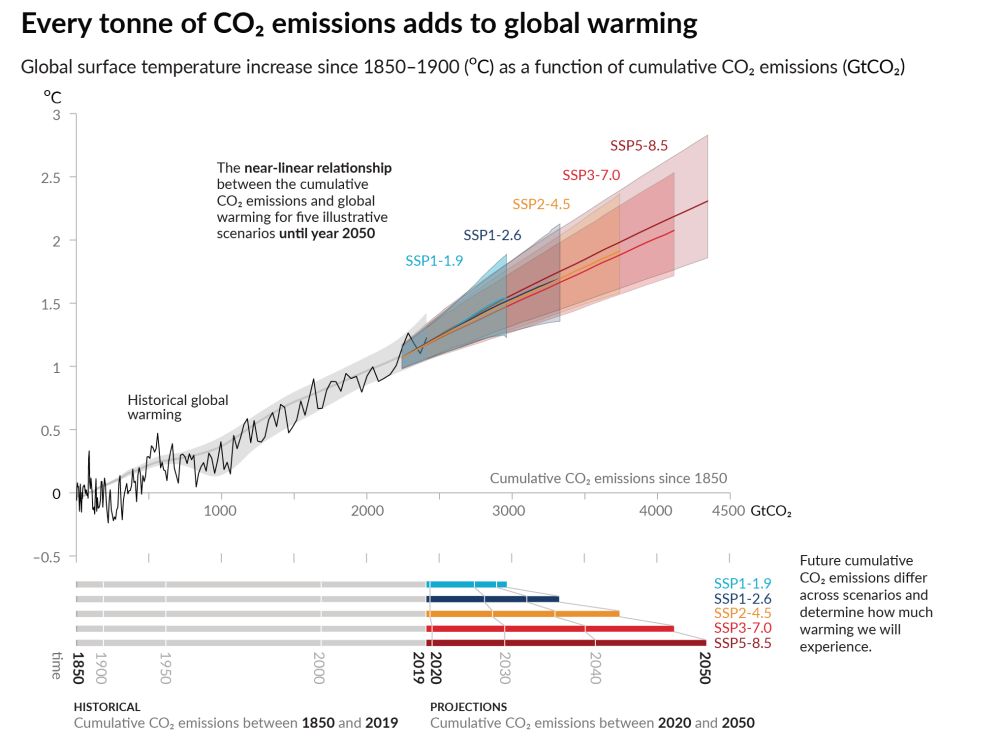
the ~linear relationship is btwn (transient!) global surface temps and *cumulative* CO₂ *emissions*
relation btwn *equilibrium* temps (let alone transient, as point in time indicators on y-axis suggest) and CO₂ concentrations is *logarithmic*
🤷
the ~linear relationship is btwn (transient!) global surface temps and *cumulative* CO₂ *emissions*
relation btwn *equilibrium* temps (let alone transient, as point in time indicators on y-axis suggest) and CO₂ concentrations is *logarithmic*
🤷

February 4, 2026 at 9:22 PM
yes, agree... @kenrice.bsky.social, @sarava.net?
the ~linear relationship is btwn (transient!) global surface temps and *cumulative* CO₂ *emissions*
relation btwn *equilibrium* temps (let alone transient, as point in time indicators on y-axis suggest) and CO₂ concentrations is *logarithmic*
🤷
the ~linear relationship is btwn (transient!) global surface temps and *cumulative* CO₂ *emissions*
relation btwn *equilibrium* temps (let alone transient, as point in time indicators on y-axis suggest) and CO₂ concentrations is *logarithmic*
🤷
Glen, again, *with respect*, if you are getting "increasingly infuriated* about random *big numbers* as tossed about above👆👇, without seemingly understanding how or which ones are ultimately describing the commonly understood *cost* to the economy (e.g., foregone future income or production, etc..)

January 30, 2026 at 11:21 PM
Glen, again, *with respect*, if you are getting "increasingly infuriated* about random *big numbers* as tossed about above👆👇, without seemingly understanding how or which ones are ultimately describing the commonly understood *cost* to the economy (e.g., foregone future income or production, etc..)
... irrespective of (additionally) mitigation spending, it also highlights the different dynamics of the payback structure.
[On the latter, I would recommend this IPCC-cited paper by one of the same co-authors of the Burgess 2026 paper iopscience.iop.org/article/10.1...
[On the latter, I would recommend this IPCC-cited paper by one of the same co-authors of the Burgess 2026 paper iopscience.iop.org/article/10.1...

January 27, 2026 at 4:44 PM
... irrespective of (additionally) mitigation spending, it also highlights the different dynamics of the payback structure.
[On the latter, I would recommend this IPCC-cited paper by one of the same co-authors of the Burgess 2026 paper iopscience.iop.org/article/10.1...
[On the latter, I would recommend this IPCC-cited paper by one of the same co-authors of the Burgess 2026 paper iopscience.iop.org/article/10.1...
especially compared to investment paybacks for adaptation spending. Which, as the authors note, changes the political economy of local spending decisions, etc.
For instance, as the IPCC AR6 WGI makes clear in FAQ's 4.1 and 4.2, the differential benefit along many *climate* impact vectors will be...
For instance, as the IPCC AR6 WGI makes clear in FAQ's 4.1 and 4.2, the differential benefit along many *climate* impact vectors will be...


January 27, 2026 at 4:44 PM
especially compared to investment paybacks for adaptation spending. Which, as the authors note, changes the political economy of local spending decisions, etc.
For instance, as the IPCC AR6 WGI makes clear in FAQ's 4.1 and 4.2, the differential benefit along many *climate* impact vectors will be...
For instance, as the IPCC AR6 WGI makes clear in FAQ's 4.1 and 4.2, the differential benefit along many *climate* impact vectors will be...
... the famous "Stabilization Wedges" (Science, 2004) and widely used WRE curves, which had us *ambitiously* just holding annual CO₂ emissions roughly constant¹ through >2060.
Far from being "We *can't* stop fossil fuels overnight," the science wasn't even saying we *needed* to *stop*, period!
Far from being "We *can't* stop fossil fuels overnight," the science wasn't even saying we *needed* to *stop*, period!


December 22, 2025 at 3:10 AM
... the famous "Stabilization Wedges" (Science, 2004) and widely used WRE curves, which had us *ambitiously* just holding annual CO₂ emissions roughly constant¹ through >2060.
Far from being "We *can't* stop fossil fuels overnight," the science wasn't even saying we *needed* to *stop*, period!
Far from being "We *can't* stop fossil fuels overnight," the science wasn't even saying we *needed* to *stop*, period!
"Much longer."
You really think so? I'm not so sure.
Consider IPCC TAR (2001) SYR Figure SPM-6, panel a.
The *most aggressive* mitigation scenarios had us continuing to emit ~7-10¹ GtCO₂ yr⁻¹ through year 2300 and beyond.
And this did not really change much for years, for instance...
You really think so? I'm not so sure.
Consider IPCC TAR (2001) SYR Figure SPM-6, panel a.
The *most aggressive* mitigation scenarios had us continuing to emit ~7-10¹ GtCO₂ yr⁻¹ through year 2300 and beyond.
And this did not really change much for years, for instance...

December 22, 2025 at 3:10 AM
"Much longer."
You really think so? I'm not so sure.
Consider IPCC TAR (2001) SYR Figure SPM-6, panel a.
The *most aggressive* mitigation scenarios had us continuing to emit ~7-10¹ GtCO₂ yr⁻¹ through year 2300 and beyond.
And this did not really change much for years, for instance...
You really think so? I'm not so sure.
Consider IPCC TAR (2001) SYR Figure SPM-6, panel a.
The *most aggressive* mitigation scenarios had us continuing to emit ~7-10¹ GtCO₂ yr⁻¹ through year 2300 and beyond.
And this did not really change much for years, for instance...
There's also the problem that - despite the strong signal - there's still so much noise in the atmospheric CO₂ dataset that it would take us ~10 yrs to detect and confidently attribute a shift in emissions from say a RCP4.5 to RCP2.6 pathway.
iopscience.iop.org/article/10.1...
1/3
iopscience.iop.org/article/10.1...
1/3

November 13, 2025 at 5:10 AM
There's also the problem that - despite the strong signal - there's still so much noise in the atmospheric CO₂ dataset that it would take us ~10 yrs to detect and confidently attribute a shift in emissions from say a RCP4.5 to RCP2.6 pathway.
iopscience.iop.org/article/10.1...
1/3
iopscience.iop.org/article/10.1...
1/3
... from the so-called "Raupach curves" (example math in this article iopscience.iop.org/article/10.1...) or similar is in the early modeling (at least until close to net-negative gets included). These also are (relatively) slow declines (absolute and rate) early, accelerating later (and then slow).

November 11, 2025 at 12:37 PM
... from the so-called "Raupach curves" (example math in this article iopscience.iop.org/article/10.1...) or similar is in the early modeling (at least until close to net-negative gets included). These also are (relatively) slow declines (absolute and rate) early, accelerating later (and then slow).
I'm less concerned with projections for final energy demand growth and more with how the simple models can get people familiar with how a plateau in CO₂ emissions can still belie a great deal of success with cumulative emissions.
If you look at most IPCC emissions mitigation models, some math
If you look at most IPCC emissions mitigation models, some math

November 11, 2025 at 12:31 PM
I'm less concerned with projections for final energy demand growth and more with how the simple models can get people familiar with how a plateau in CO₂ emissions can still belie a great deal of success with cumulative emissions.
If you look at most IPCC emissions mitigation models, some math
If you look at most IPCC emissions mitigation models, some math
although, on my X version of Liebreich's model, I mention in the comments the "Electrotech Revolution" work by Ember Energy (also tomorrow's subject on David Roberts podcast), and they have global final energy demand increasing by ~50% through 2100.
ember-energy.org/app/uploads/...
ember-energy.org/app/uploads/...

November 11, 2025 at 11:59 AM
although, on my X version of Liebreich's model, I mention in the comments the "Electrotech Revolution" work by Ember Energy (also tomorrow's subject on David Roberts podcast), and they have global final energy demand increasing by ~50% through 2100.
ember-energy.org/app/uploads/...
ember-energy.org/app/uploads/...
... from IPCC AR6 WGI (Fig SPM.10, iirc).
Volts podcast: substack.com/@drvolts/not...
Liebreich BNEF article Part 1: about.bnef.com/insights/cle...
Part 2: about.bnef.com/insights/cle...
That's about it.
Volts podcast: substack.com/@drvolts/not...
Liebreich BNEF article Part 1: about.bnef.com/insights/cle...
Part 2: about.bnef.com/insights/cle...
That's about it.

November 11, 2025 at 12:55 AM
... from IPCC AR6 WGI (Fig SPM.10, iirc).
Volts podcast: substack.com/@drvolts/not...
Liebreich BNEF article Part 1: about.bnef.com/insights/cle...
Part 2: about.bnef.com/insights/cle...
That's about it.
Volts podcast: substack.com/@drvolts/not...
Liebreich BNEF article Part 1: about.bnef.com/insights/cle...
Part 2: about.bnef.com/insights/cle...
That's about it.
Yes, non-CO₂ and agricultural/land use emissions are omitted. Adjust your own if you want. There are reasons to argue this is pretty close for purposes as well, but, as I say, it's *supposed* to be *simple*.
3. I convert forward cumulative CO₂ emissions to forward temp increases central TCRE...
3. I convert forward cumulative CO₂ emissions to forward temp increases central TCRE...


November 11, 2025 at 12:55 AM
Yes, non-CO₂ and agricultural/land use emissions are omitted. Adjust your own if you want. There are reasons to argue this is pretty close for purposes as well, but, as I say, it's *supposed* to be *simple*.
3. I convert forward cumulative CO₂ emissions to forward temp increases central TCRE...
3. I convert forward cumulative CO₂ emissions to forward temp increases central TCRE...
2. I convert fossil energy to emissions in GtCO₂ yr⁻¹ by just multiplying by 37/70 throughout, reflecting the ~2024 emissions from fossil fuels and industry. This assumes - contra historical - no forward improvements in CO₂ emissions/$GDP, but close enough.

November 11, 2025 at 12:55 AM
2. I convert fossil energy to emissions in GtCO₂ yr⁻¹ by just multiplying by 37/70 throughout, reflecting the ~2024 emissions from fossil fuels and industry. This assumes - contra historical - no forward improvements in CO₂ emissions/$GDP, but close enough.
... the purpose!
About the only things I might want to mention about my implementation:
1. On this plot, (i) energy demand and final energy are assumed equal, (ii) GDP and energy in 2025 are normalized to 100, clean and fossil energy are normalized to initial final energy shares of 30, 70% in 2025.
About the only things I might want to mention about my implementation:
1. On this plot, (i) energy demand and final energy are assumed equal, (ii) GDP and energy in 2025 are normalized to 100, clean and fossil energy are normalized to initial final energy shares of 30, 70% in 2025.
November 11, 2025 at 12:55 AM
... the purpose!
About the only things I might want to mention about my implementation:
1. On this plot, (i) energy demand and final energy are assumed equal, (ii) GDP and energy in 2025 are normalized to 100, clean and fossil energy are normalized to initial final energy shares of 30, 70% in 2025.
About the only things I might want to mention about my implementation:
1. On this plot, (i) energy demand and final energy are assumed equal, (ii) GDP and energy in 2025 are normalized to 100, clean and fossil energy are normalized to initial final energy shares of 30, 70% in 2025.
... assumptions (and I am getting to the assumptions, less so the quibbles) but the beauty of the little model is you can see where you'd want to change the assumptions to get the outcome you want to impose.
Liebreich's assumed 5% yr⁻¹ growth in clean energy supply too fast for you?...
Liebreich's assumed 5% yr⁻¹ growth in clean energy supply too fast for you?...


November 11, 2025 at 12:55 AM
... assumptions (and I am getting to the assumptions, less so the quibbles) but the beauty of the little model is you can see where you'd want to change the assumptions to get the outcome you want to impose.
Liebreich's assumed 5% yr⁻¹ growth in clean energy supply too fast for you?...
Liebreich's assumed 5% yr⁻¹ growth in clean energy supply too fast for you?...
... still yields at net-zero for CO₂ emissions from fossil-fuel and industry by ~2066, and a further increase in global surface temperature from 2025-66 of about 0.58°C, ⬋ and ⬊. Which gets you to, ballpark, 2.0°C since pre-industrial.
Now, easy to find particulars to quibble with in the...
Now, easy to find particulars to quibble with in the...
November 11, 2025 at 12:55 AM
... still yields at net-zero for CO₂ emissions from fossil-fuel and industry by ~2066, and a further increase in global surface temperature from 2025-66 of about 0.58°C, ⬋ and ⬊. Which gets you to, ballpark, 2.0°C since pre-industrial.
Now, easy to find particulars to quibble with in the...
Now, easy to find particulars to quibble with in the...
downthread, I'll include the Google Sheets spreadsheet I made, but it takes about 2 minutes using just Michael's written description in ⬋.
Interesting output: given pretty reasonable/simple assumptions (downthread), a seemingly modest near-term fossil fuel decline ⬊ and ⬊⬊..
Interesting output: given pretty reasonable/simple assumptions (downthread), a seemingly modest near-term fossil fuel decline ⬊ and ⬊⬊..

November 11, 2025 at 12:55 AM
downthread, I'll include the Google Sheets spreadsheet I made, but it takes about 2 minutes using just Michael's written description in ⬋.
Interesting output: given pretty reasonable/simple assumptions (downthread), a seemingly modest near-term fossil fuel decline ⬊ and ⬊⬊..
Interesting output: given pretty reasonable/simple assumptions (downthread), a seemingly modest near-term fossil fuel decline ⬊ and ⬊⬊..
Listening to @volts.wtf recent panel/podcast with @mliebreich.bsky.social , discussing his "Pragmatic Climate Reset", published in two parts at BNEF last September.
Michael mentioned his "simplest energy model ever" - just 4 parameters - and I decided to sketch up and add emissions and temps.
Michael mentioned his "simplest energy model ever" - just 4 parameters - and I decided to sketch up and add emissions and temps.

November 11, 2025 at 12:55 AM
Listening to @volts.wtf recent panel/podcast with @mliebreich.bsky.social , discussing his "Pragmatic Climate Reset", published in two parts at BNEF last September.
Michael mentioned his "simplest energy model ever" - just 4 parameters - and I decided to sketch up and add emissions and temps.
Michael mentioned his "simplest energy model ever" - just 4 parameters - and I decided to sketch up and add emissions and temps.
Here's some examples.
On the left, various CO₂ emissions scenarios from IPCC AR6 WGI SPM Fig. SPM.5 (a).
On the right, corresponding CO₂ concentration evolutions from IPCC AR6 WGI TS Box TS.5, Fig. 1 (e)
For both SSP1-1.9 and SSP1-2.6, concentrations peak and begin falling before emissions...
On the left, various CO₂ emissions scenarios from IPCC AR6 WGI SPM Fig. SPM.5 (a).
On the right, corresponding CO₂ concentration evolutions from IPCC AR6 WGI TS Box TS.5, Fig. 1 (e)
For both SSP1-1.9 and SSP1-2.6, concentrations peak and begin falling before emissions...


October 24, 2025 at 2:57 PM
Here's some examples.
On the left, various CO₂ emissions scenarios from IPCC AR6 WGI SPM Fig. SPM.5 (a).
On the right, corresponding CO₂ concentration evolutions from IPCC AR6 WGI TS Box TS.5, Fig. 1 (e)
For both SSP1-1.9 and SSP1-2.6, concentrations peak and begin falling before emissions...
On the left, various CO₂ emissions scenarios from IPCC AR6 WGI SPM Fig. SPM.5 (a).
On the right, corresponding CO₂ concentration evolutions from IPCC AR6 WGI TS Box TS.5, Fig. 1 (e)
For both SSP1-1.9 and SSP1-2.6, concentrations peak and begin falling before emissions...
... doesn't necessarily mean that the fundamental relationship between cumulative CO₂ emissions and warming has accelerated or moved above the best estimate of 0.45° per 1,000 GtCO₂ (0.27°C, 0.63°C) for TCRE indicated in IPCC AR6 WGI SPM Fig 10.👇
Not that although we "see" various elements...
Not that although we "see" various elements...
June 28, 2025 at 7:15 PM
... doesn't necessarily mean that the fundamental relationship between cumulative CO₂ emissions and warming has accelerated or moved above the best estimate of 0.45° per 1,000 GtCO₂ (0.27°C, 0.63°C) for TCRE indicated in IPCC AR6 WGI SPM Fig 10.👇
Not that although we "see" various elements...
Not that although we "see" various elements...
for the very fundamental reason that warming is not - and never has been! - a function of time, or year, or decade, etc.
It's primarily a function of cumulative emissions of CO₂ which *itself* has been accelerating over the past decades.
So if warming accelerated over the same time period, it...
It's primarily a function of cumulative emissions of CO₂ which *itself* has been accelerating over the past decades.
So if warming accelerated over the same time period, it...
June 28, 2025 at 6:57 PM
for the very fundamental reason that warming is not - and never has been! - a function of time, or year, or decade, etc.
It's primarily a function of cumulative emissions of CO₂ which *itself* has been accelerating over the past decades.
So if warming accelerated over the same time period, it...
It's primarily a function of cumulative emissions of CO₂ which *itself* has been accelerating over the past decades.
So if warming accelerated over the same time period, it...

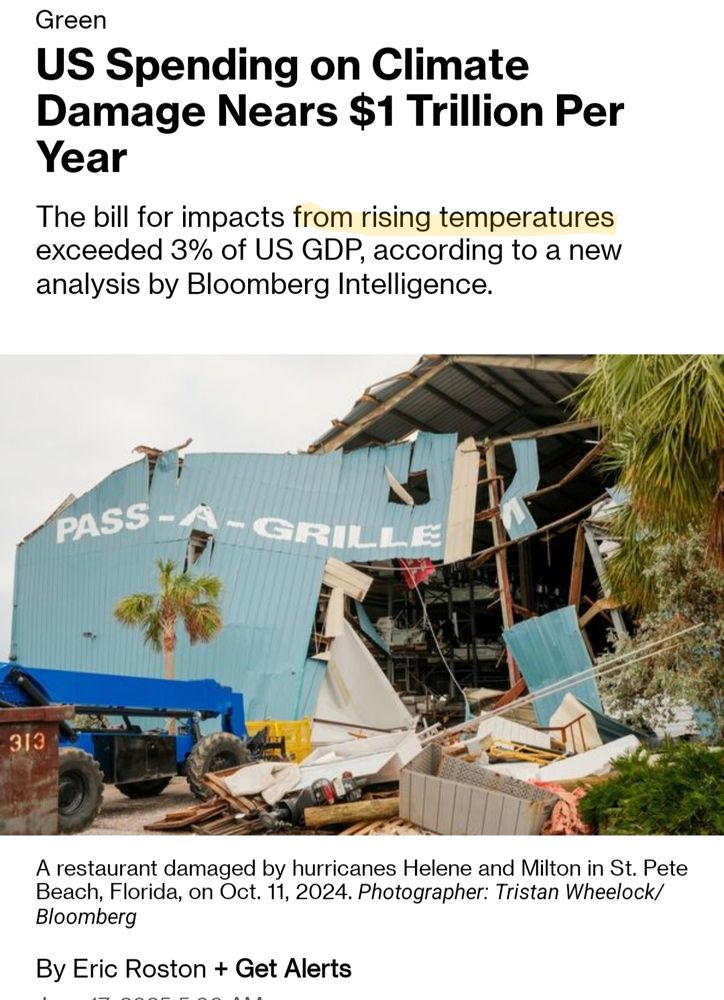
I don't know about the report, but the *article*👇also suggests that all these damages are due to climate *change*, or, say, here👇, "rising temperatures."
For instance, the article says "The Los Angeles fires in January added another $65 billion to the national total," so the entire damages were...
For instance, the article says "The Los Angeles fires in January added another $65 billion to the national total," so the entire damages were...
June 19, 2025 at 1:22 AM
I don't know about the report, but the *article*👇also suggests that all these damages are due to climate *change*, or, say, here👇, "rising temperatures."
For instance, the article says "The Los Angeles fires in January added another $65 billion to the national total," so the entire damages were...
For instance, the article says "The Los Angeles fires in January added another $65 billion to the national total," so the entire damages were...
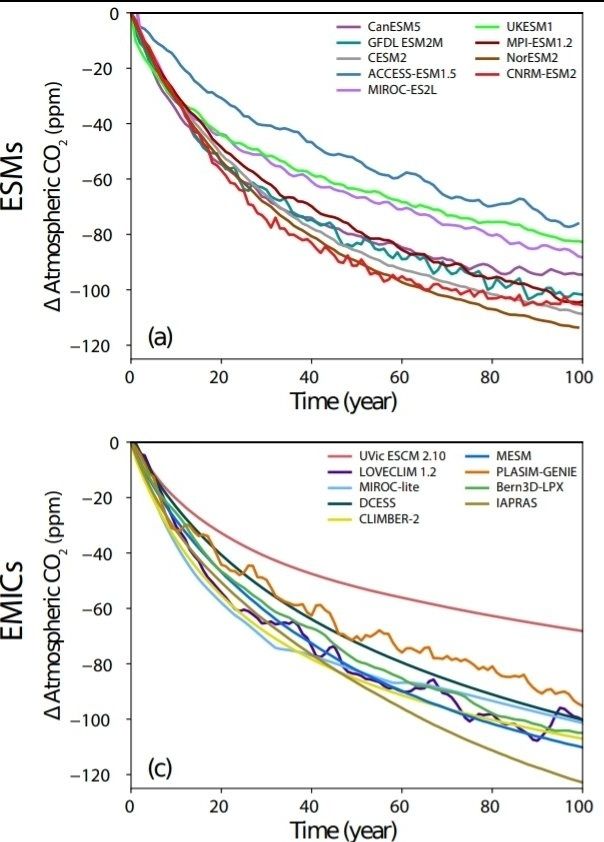
... falling but falling fast enough so that the oceans can take up the additional heat (still) being captured by (still) excess CO₂.
At the point of net zero, CO₂ concentrations are expected to be falling ~this👇fast, but that decline isn't a switch that suddenly starts at net zero. Concentrations..
At the point of net zero, CO₂ concentrations are expected to be falling ~this👇fast, but that decline isn't a switch that suddenly starts at net zero. Concentrations..
May 27, 2025 at 3:04 AM
... falling but falling fast enough so that the oceans can take up the additional heat (still) being captured by (still) excess CO₂.
At the point of net zero, CO₂ concentrations are expected to be falling ~this👇fast, but that decline isn't a switch that suddenly starts at net zero. Concentrations..
At the point of net zero, CO₂ concentrations are expected to be falling ~this👇fast, but that decline isn't a switch that suddenly starts at net zero. Concentrations..
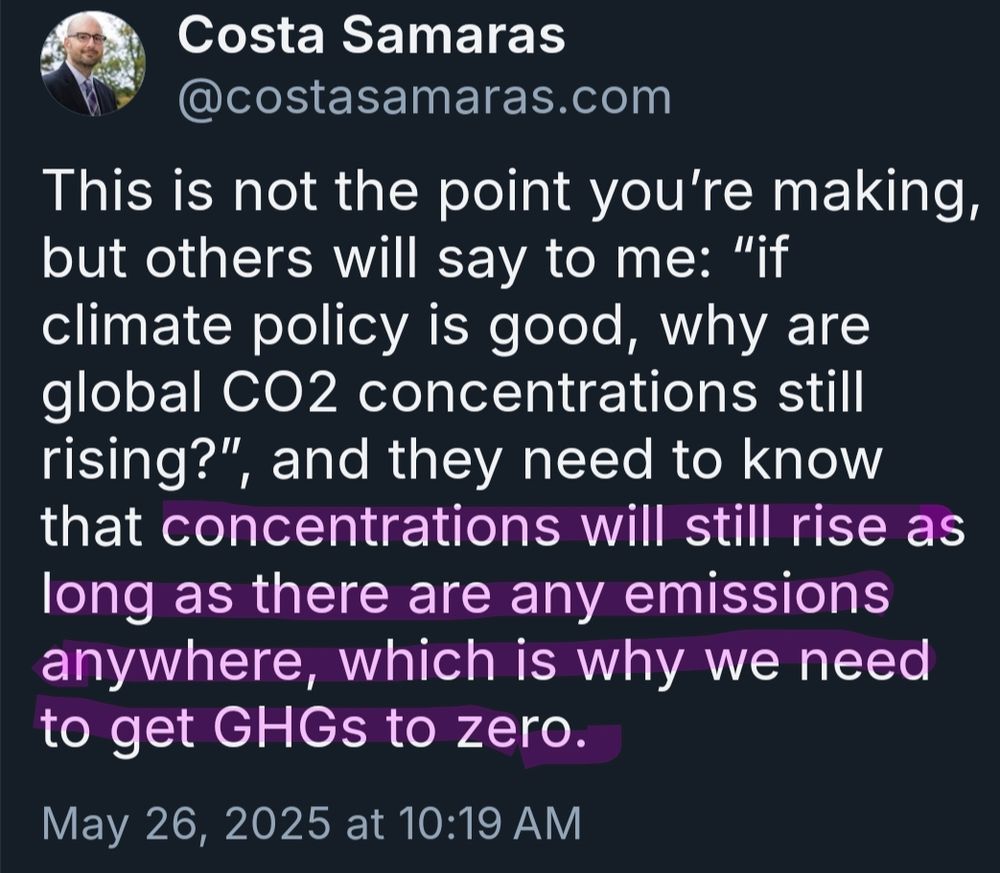
your point to Kevin doesn't hinge on it, but the highlight👇 is not true.
Atmospheric CO₂ concentrations will begin falling sometime around the point emissions fall below 15-17 GtCO₂ yr⁻¹. The problem is that they won't be falling *fast enough* to stabilize surface temps. For *that*, emissions...
Atmospheric CO₂ concentrations will begin falling sometime around the point emissions fall below 15-17 GtCO₂ yr⁻¹. The problem is that they won't be falling *fast enough* to stabilize surface temps. For *that*, emissions...
May 27, 2025 at 3:04 AM
your point to Kevin doesn't hinge on it, but the highlight👇 is not true.
Atmospheric CO₂ concentrations will begin falling sometime around the point emissions fall below 15-17 GtCO₂ yr⁻¹. The problem is that they won't be falling *fast enough* to stabilize surface temps. For *that*, emissions...
Atmospheric CO₂ concentrations will begin falling sometime around the point emissions fall below 15-17 GtCO₂ yr⁻¹. The problem is that they won't be falling *fast enough* to stabilize surface temps. For *that*, emissions...