Ryan Burge
@ryanburge.bsky.social
4.8K followers 57 following 440 posts
Teach at EIU | Research Director: For Faith Counts | Books: The Nones & 20 Myths | Pastor: ABCUSA | Graphs about Religion
Posts Media Videos Starter Packs
ryanburge.bsky.social
It's a great question. I have lots of thoughts about the data that I use in my work and how I present that information to audiences.

Unfortunately, the character limits of this platform and others like it aren't conducive to that type of nuanced discussion.
ryanburge.bsky.social
It's something I mention in lots and lots of talks.

I show this slide and say:

The Gallup estimate of nones is 23%. That's probably too low.
The CES estimate is 35%. That's probably too high.

Pew and GSS have the number around 30%. That's probably the best guess we have.
ryanburge.bsky.social
In the words of Obama surrounding gay marriage, "my thinking has evolved."

The new GSS data coming out a few weeks ago was a big catalyst for that.

YouGov is a reputable polling firm. It's not like the Bible Society used Survey Monkey.

But they struggle w/young respondents.
ryanburge.bsky.social
This is something I note in a forthcoming piece.

CES is YouGov.

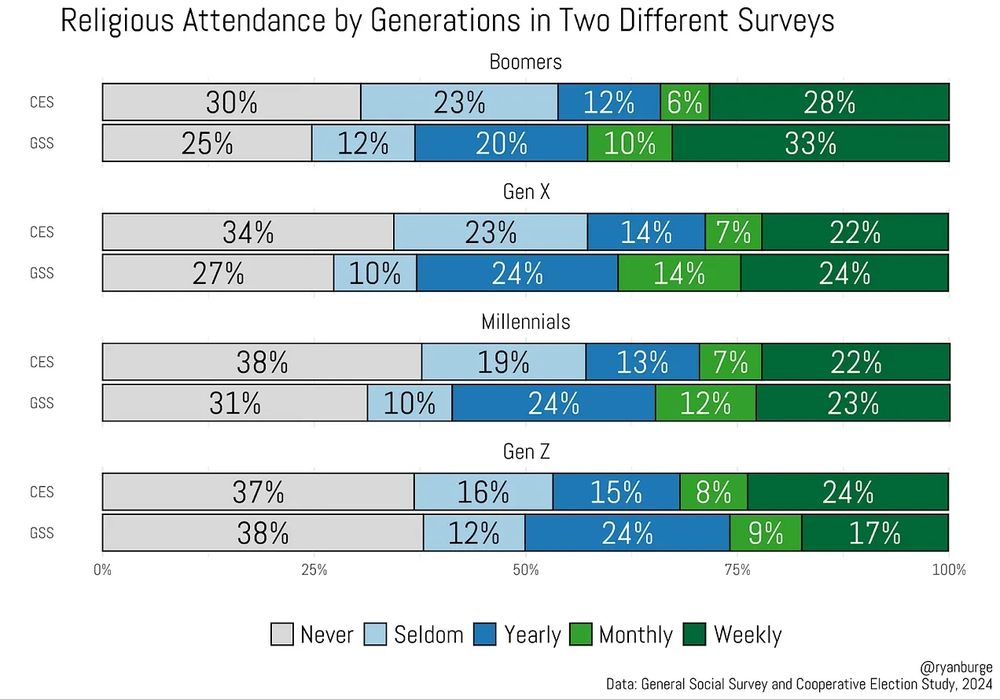
Huge gaps in attendance in the Gen Z part of the sample when comparing to GSS.

But what's fascinating is that on affiliation measures, there is evidence of stasis. That's true in CES, RLS, and GSS.
ryanburge.bsky.social
New post today where I make the claim that if you are trying to study how religion impacts vote choice,

Then attendance has almost no utility at all.

Affiliation tells you a whole lot more.

www.graphsaboutreligion.com/p/the-politi...
The Political Paradox: Why Never-Attending Christians and Atheists Are Worlds Apart
Religious attendance probably obscures more than it reveals when it comes to voting behavior
www.graphsaboutreligion.com
ryanburge.bsky.social
"If you say you are a Christian who never attends church, you might as well be an atheist."

That may be valid from a theological perspective.

But politically, those two groups are worlds apart.

63% of never attending Protestants voted for Trump.

It was 11% of atheists.
ryanburge.bsky.social
"Homosexual couples should the right to marry one another."

Share agreeing in 2018, 2021, 2022, 2024

Democrats:
77% -> 79% -> 82% -> 78%

Independents:
62% -> 58% -> 66% ->68%

Republicans:
58% -> 46% -> 51% -> 46%
ryanburge.bsky.social
Left out the Evangelical Lutheran Church of America!

2.9M.
ryanburge.bsky.social
Always helpful to see how large (or small) a bunch of religious denominations/groups are.

This data is compiled by me from a bunch of disparate sources all over the internet.

There should be some type of universal reporting system for this.

So, someone get on it.
ryanburge.bsky.social
Support for legal access to an abortion if a woman wants one for any reason.

2000:
Never Church Attenders: 52%
Weekly Attenders: 23%

2024:
Never Church Attenders: 74% (+22)
Weekly Attenders: 33% (+10)
ryanburge.bsky.social
A new post today in my ongoing series about religion and the 2024 election.

This one focuses on the Jewish vote.

Still solidly Democratic.

A pretty standard election for the Jewish portion of the electorate.

www.graphsaboutreligion.com/p/2024-elect...
2024 Election Post-Mortem: Jews
Is the alliance between Jewish voters and the Democrats weakening?
www.graphsaboutreligion.com
ryanburge.bsky.social
What role should the US take in the conflict between Israel and Hamas?

22% of the public says "stay out of it."

26% wants to send arms to Israel. It's 59% of Jews.

23% wants to deploy US troops to the region. It's 40% of Jews.

Basically no one wants to arm Hamas.
ryanburge.bsky.social
I look at questions like what % of clergy believe in:

Literal Adam and Eve
The bodily resurrection of Jesus
Hell
Miraculous healing
Astrology
Reincarnation

I analyze data about their views of the Bible.

And the superiority of their worldview

www.graphsaboutreligion.com/p/how-certai...
How Certain Are Clergy of their Faith?
This post has been unlocked through a generous grant from the Lilly Endowment for the Association of Religion Data Archives (ARDA).
www.graphsaboutreligion.com
ryanburge.bsky.social
I've got a really fun post on the newsletter today about the religious beliefs of CLERGY.

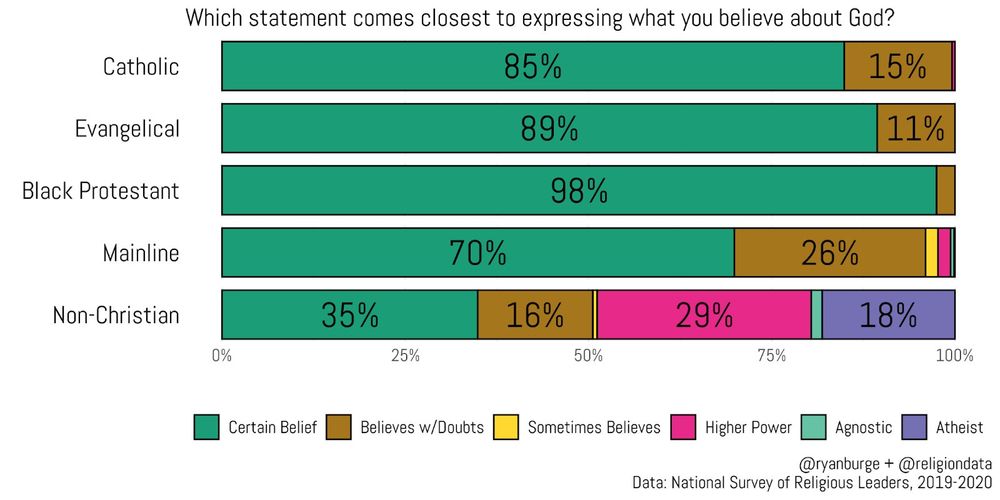
This question asks about religious beliefs.

98% of Black Protestant clergy believe in God without a doubt.

Evangelicals: 89%
Catholics: 85%
Mainline: 70%
ryanburge.bsky.social
Lots of analysis today about the LDS vote.

I spent some extra time trying to sort out how younger LDS feel about politics.

Just 31% of young LDS voted for Trump in 2020.
It was 56% in 2024.

www.graphsaboutreligion.com/p/2024-elect...
2024 Election Post-Mortem: Latter-day Saints
Are young Mormons abandoning the GOP?
www.graphsaboutreligion.com
ryanburge.bsky.social
How would I describe Latter-day Saints politically?

Clearly Republicans.

They were hesitant to go full MAGA back in 2016.

But a whole bunch of them warmed to Trump in 2020 and 2024.

It's hard to know the 'default' distribution of LDS votes, though.

Maybe ~70% GOP.
ryanburge.bsky.social
The share of Catholics who attend Mass weekly in 2008 vs 2024, by age.

18-35: +11
36-44: +5
45-54: -5
55-64: -13
65+: -21
ryanburge.bsky.social
My annual assessment of the state of the Southern Baptist Convention, right before their annual meeting.

You can try and spin it however you want - but the data doesn't lie:

The negative trends far, far outweigh the positive ones.

www.graphsaboutreligion.com/p/2024-marks...
2024 Marks Another Chapter in the SBC’s Long Slide
The Slow-Motion Collapse of America’s Largest Protestant Denomination
www.graphsaboutreligion.com
ryanburge.bsky.social
Let me help you all contextualize just how bad the Southern Baptist Convention's membership losses are.

They have shed ~3.6M members since 2006.

The entire Assemblies of God is 2.98M.
The ELCA is 2.9M
Lutheran Church - MO Synod is 1.7M
American Baptists are 1.2M
ryanburge.bsky.social
I try to explain Black Americans, religion, and the vote in the 2024 election.

I do believe there is some evidence of a slight shift toward the GOP, but it's certainly not overwhelming evidence at this point.

www.graphsaboutreligion.com/p/2024-elect...
2024 Election Post-Mortem: Black Americans, Religion and the Vote
Is there evidence of a racial realignment in the data?
www.graphsaboutreligion.com
ryanburge.bsky.social
Black Christians are much more socially moderate than the the average Democrat.

24 points more likely to want to ban abortion pills in the mail.

20 points more likely to support a ban on gender transition for minors.

30 points more likely to support school vouchers
ryanburge.bsky.social
You know that narrative that is out there about a religious revival among Gen Z?

I get asked about it a lot.

This is brand new data from the General Social Survey (released yesterday).

Gen Z are the least likely to be weekly attenders.
The most likely to be never attenders.
ryanburge.bsky.social
Couple things.

That first graph is a measure of religious attendance.

That second graph is a measure of religious affiliation.

It's different surveys, too.

They come to different conclusions.

Polling young people is very hard.
ryanburge.bsky.social
62% of white evangelicals have watched Fox News in the past 24 hours.

Just 16% of atheists have watched Fox.

Meanwhile, 48% of atheists have watched MSNBC.

Just 13% of white evangelicals have watched MSNBC.