


Seth Kasowitz
@skasowitz.bsky.social
Molecular Biologist - Data Scientist - Father
This week's #TidyTuesday looks at data from a European Citizen Science project examining edible plants. Comparing growth requirements we can find something to grow under a wide range of conditions... just get them out of the shade!
#DataViz #ggplot2
#DataViz #ggplot2

February 2, 2026 at 4:40 PM
This week's #TidyTuesday looks at data from a European Citizen Science project examining edible plants. Comparing growth requirements we can find something to grow under a wide range of conditions... just get them out of the shade!
#DataViz #ggplot2
#DataViz #ggplot2
How can you organize NASA's daily astronomy pictures ? Some quick topic modeling of the explanations included in the APOD dataset for #TidyTuesday.

January 23, 2026 at 8:22 PM
How can you organize NASA's daily astronomy pictures ? Some quick topic modeling of the explanations included in the APOD dataset for #TidyTuesday.

For this #TidyTuesday we look into data on languages spoken across Africa.
I focused on languages spoken in a single country, and make a map indicating which "exclusive" language is spoken by the most people relative to the country's pop.
Code: sethkasowitz.com/posts/2026-0...
#RStatis #DataViz
I focused on languages spoken in a single country, and make a map indicating which "exclusive" language is spoken by the most people relative to the country's pop.
Code: sethkasowitz.com/posts/2026-0...
#RStatis #DataViz

January 13, 2026 at 8:28 PM
For this #TidyTuesday we look into data on languages spoken across Africa.
I focused on languages spoken in a single country, and make a map indicating which "exclusive" language is spoken by the most people relative to the country's pop.
Code: sethkasowitz.com/posts/2026-0...
#RStatis #DataViz
I focused on languages spoken in a single country, and make a map indicating which "exclusive" language is spoken by the most people relative to the country's pop.
Code: sethkasowitz.com/posts/2026-0...
#RStatis #DataViz
Day 4 of the #30DayMapChallenge and I decided to work out how to plot some arbitrary paths from my Timeline. I spent too much time just working out the exported data structure to look for anything interesting. Just trust that on at least one of these I am driving at an avg of 5 mph for 15 miles.

November 4, 2025 at 7:56 PM
Day 4 of the #30DayMapChallenge and I decided to work out how to plot some arbitrary paths from my Timeline. I spent too much time just working out the exported data structure to look for anything interesting. Just trust that on at least one of these I am driving at an avg of 5 mph for 15 miles.
Immediately falling behind on the #30DayMapChallenge! Playing catch-up today and hopelessly telling myself I will make time to get ahead.
So here are days 2 and 3 using a single data source:
Day 2: Lines
Day 3: Polygons
Real challenge: Calculating arcs 😬
Code: sethkasowitz.com/posts/2025-1...
So here are days 2 and 3 using a single data source:
Day 2: Lines
Day 3: Polygons
Real challenge: Calculating arcs 😬
Code: sethkasowitz.com/posts/2025-1...


November 3, 2025 at 5:32 PM
Immediately falling behind on the #30DayMapChallenge! Playing catch-up today and hopelessly telling myself I will make time to get ahead.
So here are days 2 and 3 using a single data source:
Day 2: Lines
Day 3: Polygons
Real challenge: Calculating arcs 😬
Code: sethkasowitz.com/posts/2025-1...
So here are days 2 and 3 using a single data source:
Day 2: Lines
Day 3: Polygons
Real challenge: Calculating arcs 😬
Code: sethkasowitz.com/posts/2025-1...
Never participated in the #30DayMapChallenge and I've never created a map with Python.
Day 1 Challenge: Points
Taking a look at the NYC polling locations for Election Day.
Data from NYS Geospatial Services
Code: sethkasowitz.com/posts/2025-1...
Day 1 Challenge: Points
Taking a look at the NYC polling locations for Election Day.
Data from NYS Geospatial Services
Code: sethkasowitz.com/posts/2025-1...

November 1, 2025 at 5:17 PM
Never participated in the #30DayMapChallenge and I've never created a map with Python.
Day 1 Challenge: Points
Taking a look at the NYC polling locations for Election Day.
Data from NYS Geospatial Services
Code: sethkasowitz.com/posts/2025-1...
Day 1 Challenge: Points
Taking a look at the NYC polling locations for Election Day.
Data from NYS Geospatial Services
Code: sethkasowitz.com/posts/2025-1...
Oake and Willow. Litter mates, menaces, doofuses.

September 28, 2025 at 12:04 AM
Oake and Willow. Litter mates, menaces, doofuses.


Day 1 of the #30DayChartChallenge. Looking at the fraction of the U.S. population with access to fluoride in their drinking water we see this proportion hasn't increased in years.
📊 Code: github.com/skasowitz/30...
🌎 Data: National Center for Chronic Disease Prevention and Health Promotion
📊 Code: github.com/skasowitz/30...
🌎 Data: National Center for Chronic Disease Prevention and Health Promotion

April 1, 2025 at 3:08 PM
Day 1 of the #30DayChartChallenge. Looking at the fraction of the U.S. population with access to fluoride in their drinking water we see this proportion hasn't increased in years.
📊 Code: github.com/skasowitz/30...
🌎 Data: National Center for Chronic Disease Prevention and Health Promotion
📊 Code: github.com/skasowitz/30...
🌎 Data: National Center for Chronic Disease Prevention and Health Promotion
We were honored to host the 2025 Squirrel Summit. The yard will forever be covered in peanut shells.

March 6, 2025 at 7:23 PM
We were honored to host the 2025 Squirrel Summit. The yard will forever be covered in peanut shells.
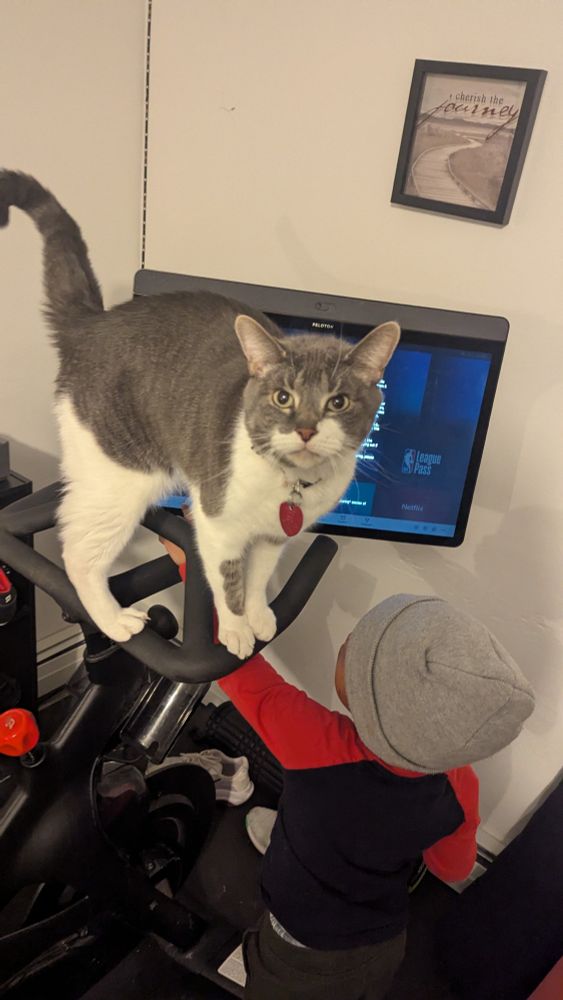
One wants to completely supplant my human family. The other tolerates me for my ability to acquire and distribute chicken.

January 27, 2025 at 2:52 AM
One wants to completely supplant my human family. The other tolerates me for my ability to acquire and distribute chicken.
Oake and Willow. Littermates, rescues, life disrupters.

January 27, 2025 at 2:38 AM
Oake and Willow. Littermates, rescues, life disrupters.
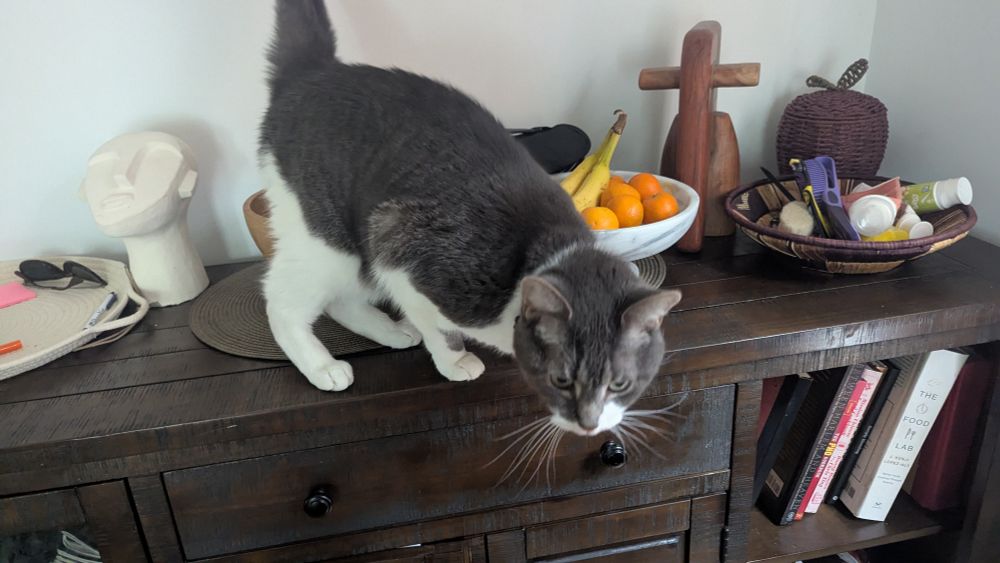
This creature is incapable of remorse.


January 23, 2025 at 7:59 PM
This creature is incapable of remorse.
Guess we're not going anywhere today.

December 25, 2024 at 1:47 PM
Guess we're not going anywhere today.
Oak and Willow, littermates adopted through a shelter in 2020.


November 24, 2024 at 10:36 PM
Oak and Willow, littermates adopted through a shelter in 2020.
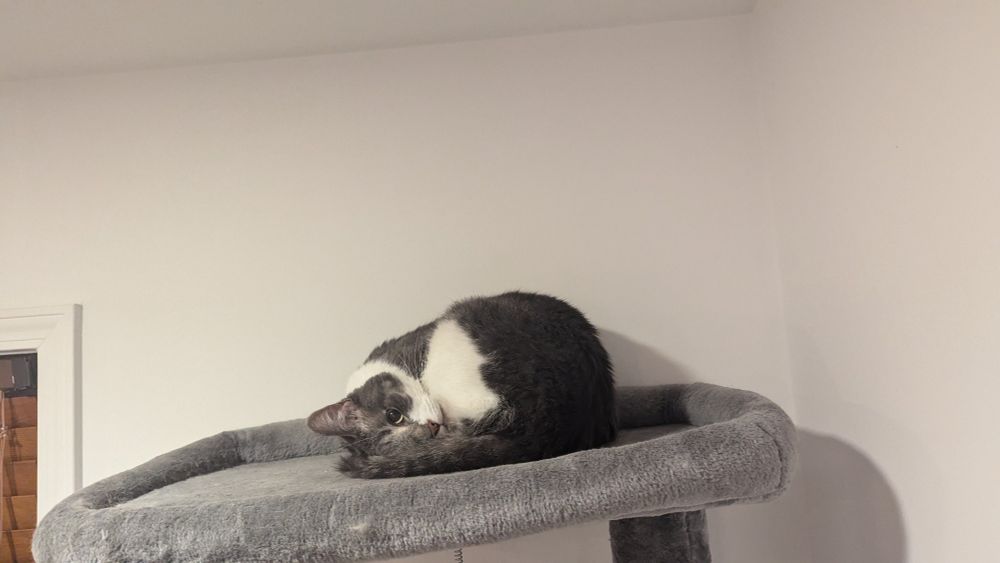
Wishing I could be so chill...

November 7, 2024 at 11:11 PM
Wishing I could be so chill...

One is only perturbed by my presence, the other craves nothing else.

November 5, 2024 at 11:58 PM
One is only perturbed by my presence, the other craves nothing else.
Let's see some cats!

November 4, 2024 at 12:34 AM
Let's see some cats!
Welcoming people to Bluesky


October 17, 2024 at 11:35 PM
Welcoming people to Bluesky
Nature's doofiest hunter.


October 14, 2024 at 6:45 PM
Nature's doofiest hunter.