YouGov America
@today.yougov.com
5.6K followers 980 following 3.4K posts
YouGov gathers real opinions and behaviors from worldwide panel members to power insights into what the world thinks. https://today.yougov.com/ Join our panel and share your opinion: account.yougov.com For press inquiries: [email protected]
Posts Media Videos Starter Packs
Pinned
today.yougov.com
YouGov now has a weekly newsletter on substack!
Sign up and read past issues of “The Surveyor” here: yougovamerica.substack.com
Reposted by YouGov America
opiniontoday.bsky.social
More Americans disapprove than approve of Trump's and Hegseth's handling of the military. Approval of U.S. generals and admirals' job handling is higher.
(@today.yougov.com)
today.yougov.com/politics/art...
Reposted by YouGov America
opiniontoday.bsky.social
More Americans say that Republicans in Congress and President Trump are most responsible for the shutdown than say Democrats in Congress are.
(@today.yougov.com)
today.yougov.com/politics/art...
Reposted by YouGov America
opiniontoday.bsky.social
President Trump has hit new 2nd-term lows in net approval among several groups:
• 33% of women approve of Trump and 61% disapprove, a net approval of -28
• 43% of those 65 & older approve, 55% disapprove
• 25% of Hispanics approve, 71% disapprove
(@today.yougov.com)
today.yougov.com/politics/art...
today.yougov.com
NEW Economist/YouGov Oct 4-6
How much do Americans expect to be affected by the shutdown?
A great deal 12%
Somewhat 28%
A little 30%
Not at all 30%
today.yougov.com/politics/art...
A chart of YouGov polling data with the headline: "How much do you think you will be personally affected by the government shutdown?."

The chart's sub-headline is: "%."
today.yougov.com
NEW Economist/YouGov Oct 4-6
Majorities of Democrats (60%) and Republicans (65%) prefer for lawmakers to compromise to reach a budget agreement, even if it means sacrificing some priorities that they believe in
today.yougov.com/politics/art...
A chart of YouGov polling data with the headline: "Most Democrats and Republicans think lawmakers should compromise on the budget, even if it means sacrificing some priorities."

The chart's sub-headline is: "If you had to choose, which approach would you prefer that members of Congress take when negotiating a federal budget agreement? (% who say lawmakers should...)."
today.yougov.com
NEW Economist/YouGov Oct 4-6
Who Americans blame most for the shutdown:
Trump and Republicans in Congress 41%
Democrats in Congress 30%
Both equally 23%
today.yougov.com/politics/art...
A chart of YouGov polling data with the headline: "Who do Americans blame most for the shutdown?."

The chart's sub-headline is: "Who do you blame the most for the shutdown of the federal government? (%)."
today.yougov.com
NEW Economist/YouGov: The shutdown
Net approval of handling of the shutdown
Donald Trump -21
Republicans in Congress -23
Democrats in Congress -25
today.yougov.com/politics/art...
A chart of YouGov polling data with the headline: "Net approval of handling of the government shutdown by Trump and Congress."

The chart's sub-headline is: "Do you approve or disapprove of how each of the following are handling the current shutdown of the federal government? (% who approve - % who disapprove)."

The chart has the note: "Note: Responses of "not sure" are not shown."
today.yougov.com
% of U.S. adults saying they blame [the Palestinian side | the Israeli side] more for the escalation of violence in the Israeli‑Palestinian conflict, in polls conducted...
Oct 7, 2024: 31% | 19%
Oct 7, 2025: 26% | 25%
today.yougov.com/topics/inter...
today.yougov.com/topics/polit...
YouGov survey results by political party for the question, Who do you blame more for the escalation of violence in the Israeli‑Palestinian conflict?
today.yougov.com
% of U.S. adults saying Donald Trump's approach to the Israel‑Hamas war has been [too supportive | not supportive enough] of Israel, in polls conducted...
Feb 5: 21% | 7%
Oct 7: 34% | 9%
today.yougov.com/topics/inter...
today.yougov.com/topics/polit...
YouGov survey results by political party for the question, Do you think that Donald Trump's approach to the Israel‑Hamas war has been...?
today.yougov.com
Oct 7 poll of 1,857 U.S. adults (+/-2.9%)
% who think a peace deal will | won't be reached in the next week between Israel and Hamas
U.S. adults 14% | 48%
Democrats 6% | 58%
Independents 11% | 49%
Republicans 24% | 37%
today.yougov.com/topics/polit...
YouGov survey results by political party for the question, Do you think a peace deal will be reached in the next week between Israel and Hamas?
Reposted by YouGov America
alxrh.bsky.social
How is Gavin Newsom's social media strategy working out? For starters, he has fewer followers than Trump, though most Americans don't follow either. His posts are seen less often than Trump's as well.

New article at @today.yougov.com: today.yougov.com/politics/art...
today.yougov.com
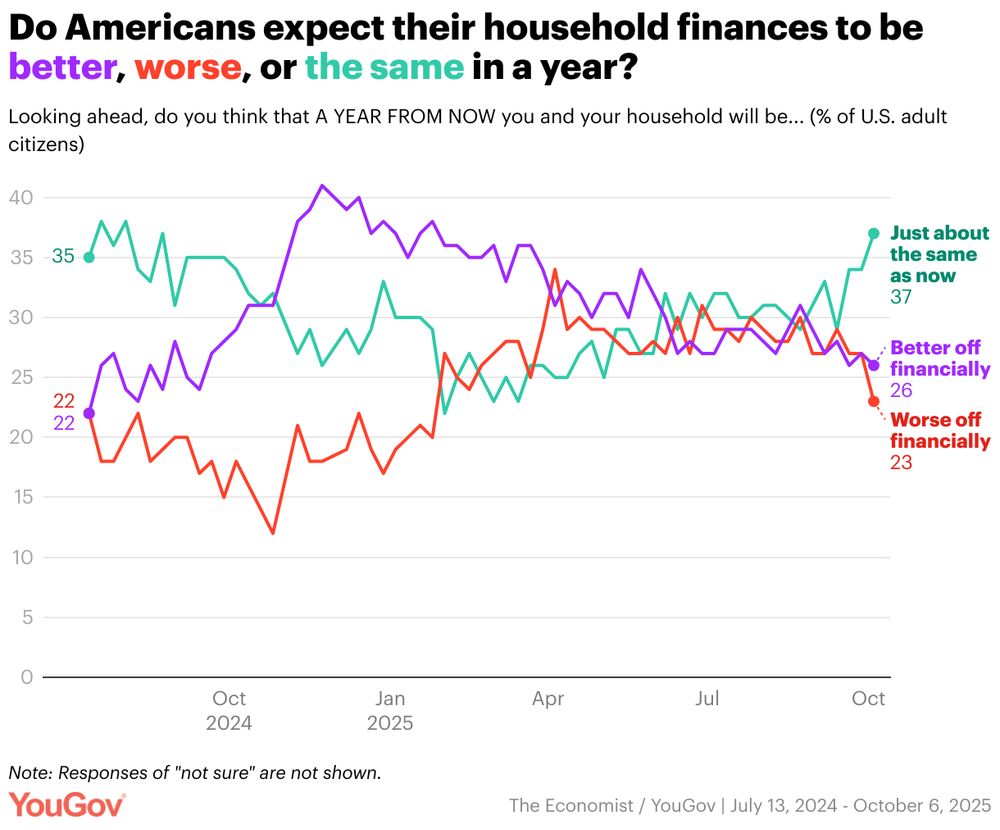
NEW Economist/YouGov
% of U.S. adult citizens saying a year from now they and their household will be better off | worse off financially
Jan 26-28: 38% | 20%
Oct 4-6: 26% | 23%
d3nkl3psvxxpe9.cloudfront.net/documents/ec...
A line chart of YouGov polling data with the headline: "Do Americans expect their household finances to be better, worse, or the same in a year?."

The chart's sub-headline is: "Looking ahead, do you think that A YEAR FROM NOW you and your household will be... (% of U.S. adult citizens)."

The chart has the note: "Note: Responses of "not sure" are not shown."
today.yougov.com
NEW Economist/YouGov Oct 4-6
% of Americans whose top issue is...
Inflation/prices 24%
Jobs and the economy 12%
Health care 11% (15% of Democrats | 7% of Republicans)
Immigration 10% (4% | 20%)
Civil rights 8% (14% | 1%)
Civil liberties 7% (14% | 1%)
d3nkl3psvxxpe9.cloudfront.net/documents/ec...
A line chart of YouGov polling data with the headline: "Americans' most important issues."

The chart's sub-headline is: "Which of these is the most important issue for you? (% of U.S. adult citizens)."

The chart has the note: "Note: This chart shows the four most frequently chosen issues from a list of more than a dozen issues. Other issues are not shown."
today.yougov.com
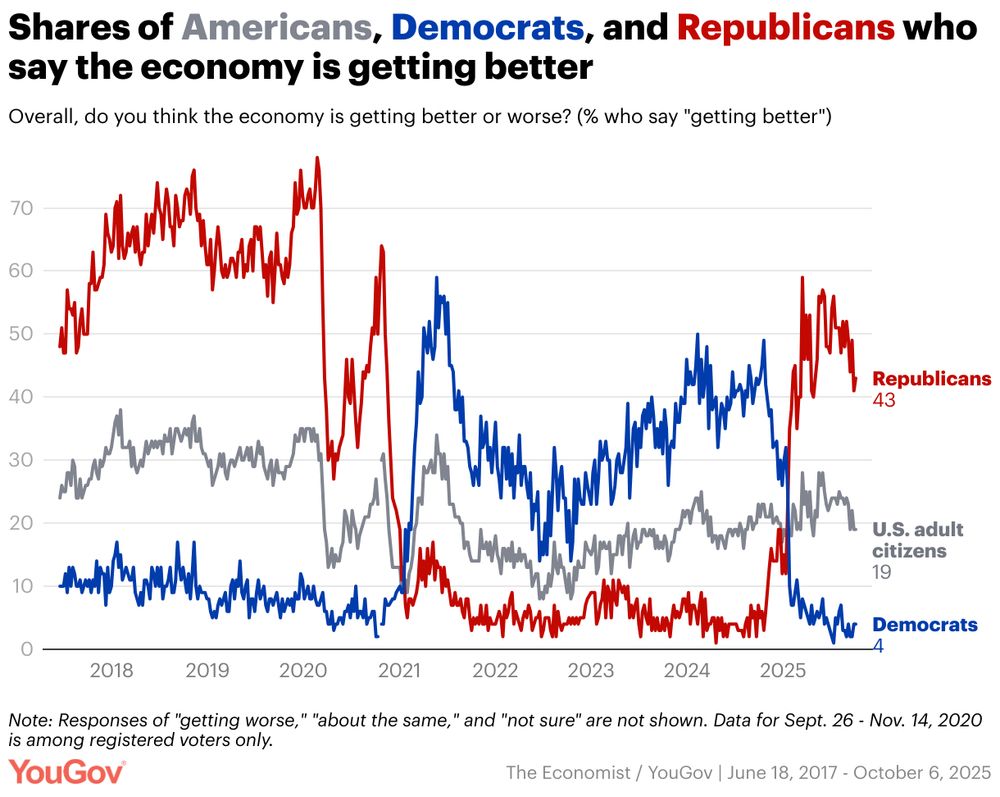
NEW Economist/YouGov
% saying [at the start of Donald Trump's second term | now] that they think that overall, the economy is getting better
U.S. adult citizens 19% | 19%
Democrats 10% | 4%
Republicans 35% | 43%
d3nkl3psvxxpe9.cloudfront.net/documents/ec...
A line chart of YouGov polling data with the headline: "Shares of Americans, Democrats, and Republicans who say the economy is getting better."

The chart's sub-headline is: "Overall, do you think the economy is getting better or worse? (% who say "getting better")."

The chart has the note: "Note: Responses of "getting worse," "about the same," and "not sure" are not shown. Data for Sept. 26 - Nov. 14, 2020 is among registered voters only."
today.yougov.com
NEW Economist/YouGov
% of U.S. adult citizens saying they think that overall, the economy is getting better | worse...
At the start of Donald Trump's second term 19% | 37%
Now 19% | 53%
d3nkl3psvxxpe9.cloudfront.net/documents/ec...
A line chart of YouGov polling data with the headline: "Is the U.S. economy getting better or worse?."

The chart's sub-headline is: "Overall, do you think the economy is getting better or worse? (% of U.S. adult citizens)."

The chart has the note: "Note: Responses of "don't know" are not shown. Data for Sept. 26 - Nov. 14, 2020 is among registered voters only."
today.yougov.com
NEW Economist/YouGov
Net job approval for the president at this stage of...
• Trump's second term -17 (low -18; start +6)
• Biden's term -5
• Trump's 1st term -15
d3nkl3psvxxpe9.cloudfront.net/documents/ec...
A line chart of YouGov polling data with the headline: "Net job approval among U.S. adult citizens in Trump's first term, Biden's term, and Trump's second term."

The chart's sub-headline is: "Do you approve or disapprove of the way [Joe Biden / Donald Trump] is handling his job as President? (% of U.S. adult citizens who strongly or somewhat approve minus the % who strongly or somewhat disapprove)."

The chart has the note: "Note: Responses of "not sure" are not shown. Data for Sept. 26 - Nov. 14, 2020 is among registered voters only."
today.yougov.com
NEW Economist/YouGov
Net job approval for Donald Trump [at the start of his second term | now] among...
U.S. adult citizens +6 | -17
Men +17 | -5
Women -5 | -28 [new low for second term]
d3nkl3psvxxpe9.cloudfront.net/documents/ec...
A line chart of YouGov polling data with the headline: "Approval by gender of Donald Trump's second-term job performance."

The chart's sub-headline is: "Do you approve or disapprove of the way Donald Trump is handling his job as President? (% who strongly or somewhat approve minus the % who strongly or somewhat disapprove)."

The chart has the note: "Note: Responses of "don't know" are not shown."
today.yougov.com
NEW Economist/YouGov
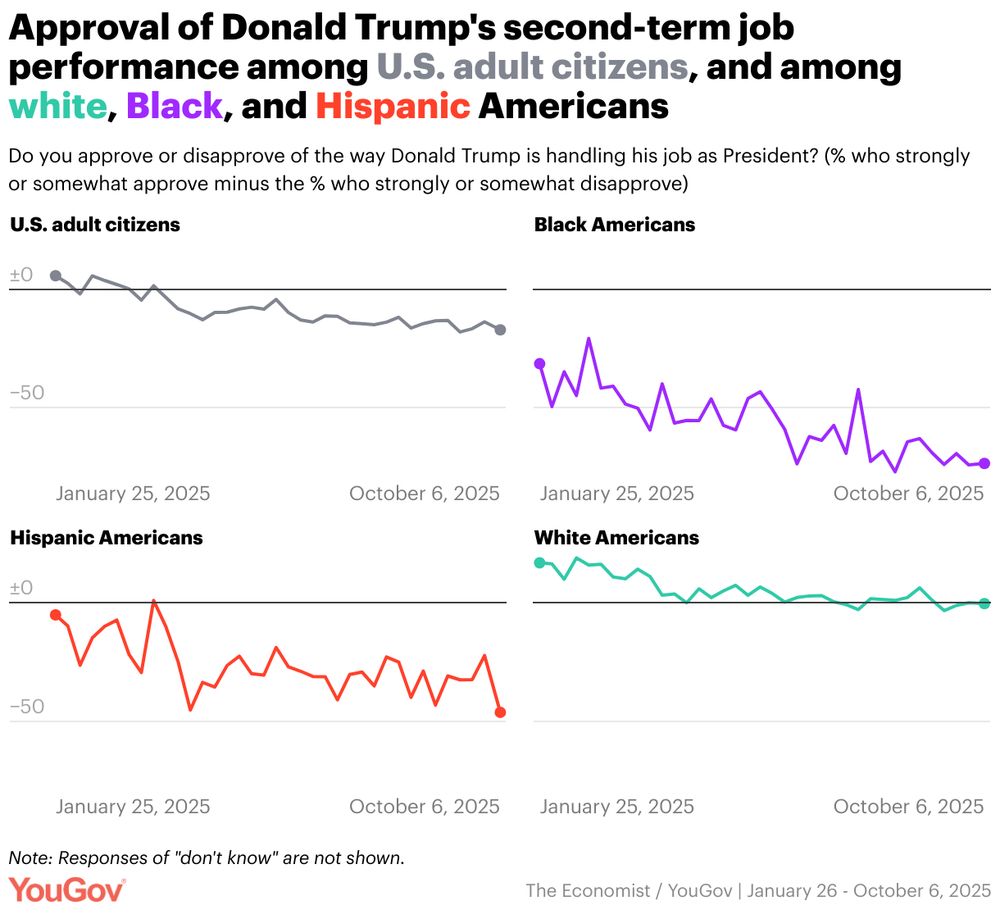
Net job approval for Donald Trump [at the start of his second term | now] among...
White Americans +17 | 0
Hispanic Americans -5 | -46
Black Americans -31 | -73
d3nkl3psvxxpe9.cloudfront.net/documents/ec...
A multiple line chart of YouGov polling data with the headline: "Approval of Donald Trump's second-term job performance among U.S. adult citizens, and among white, Black, and Hispanic Americans."

The chart's sub-headline is: "Do you approve or disapprove of the way Donald Trump is handling his job as President? (% who strongly or somewhat approve minus the % who strongly or somewhat disapprove)."

The chart has the note: "Note: Responses of "don't know" are not shown."
today.yougov.com
NEW Economist/YouGov
Net approval for Trump [at the start of his second term | when last asked] for his handling of...
Crime +12 | -7
Immigration +11 | -8
Foreign policy +3 | -15
Jobs & economy +12 | -16
Inflation/prices +6 | -29
d3nkl3psvxxpe9.cloudfront.net/documents/ec...
A line chart of YouGov polling data with the headline: "Approval of Donald Trump's handling of major issues."

The chart's sub-headline is: "Do you approve or disapprove of the way Donald Trump is handling these specific issues? (% of U.S. adult citizens who strongly or somewhat approve minus the % who strongly or somewhat disapprove)."

The chart has the note: "Note: Responses of "no opinion" and "not sure" are not shown. Not all issues are asked about every week. Overall approval comes from the question, "Do you approve or disapprove of the way Donald Trump is handling his job as President?""
today.yougov.com
NEW Economist/YouGov
% of U.S. adult citizens who approve | disapprove of Donald Trump
This week 39% | 56% (-17)
Last week 40% | 54%
Start of term 49% | 43%
d3nkl3psvxxpe9.cloudfront.net/documents/ec...
A line chart of YouGov polling data with the headline: "Approval and disapproval of Trump's job performance."

The chart's sub-headline is: "Do you approve or disapprove of the way Donald Trump is handling his job as President? (% of U.S. adult citizens)."
today.yougov.com
NEW Economist/YouGov Oct 4-6
% who approve | disapprove of Donald Trump
U.S. adult citizens 39% | 56% (-17)
Last week 40% | 54%
Start of term 49% | 43%

Democrats 5% | 93%
Independents 27% | 65%
Republicans 86% | 11%
Men 46% | 51%
Women 33% | 61%
d3nkl3psvxxpe9.cloudfront.net/documents/ec...
A stacked bar chart of YouGov polling data with the headline: "Approval and disapproval of Trump's job performance."

The chart's sub-headline is: "Do you approve or disapprove of the way Donald Trump is handling his job as President? (%)."
today.yougov.com
% who think ICE wrongly arrests U.S. citizens [often or sometimes | rarely or never]
U.S. adults 60% | 30%
Democrats 89% | 6%
Independents 62% | 23%
Republicans 31% | 57%
today.yougov.com/topics/polit...
YouGov survey results by political party for the question, How often do you think ICE wrongly arrests U.S. citizens?
today.yougov.com
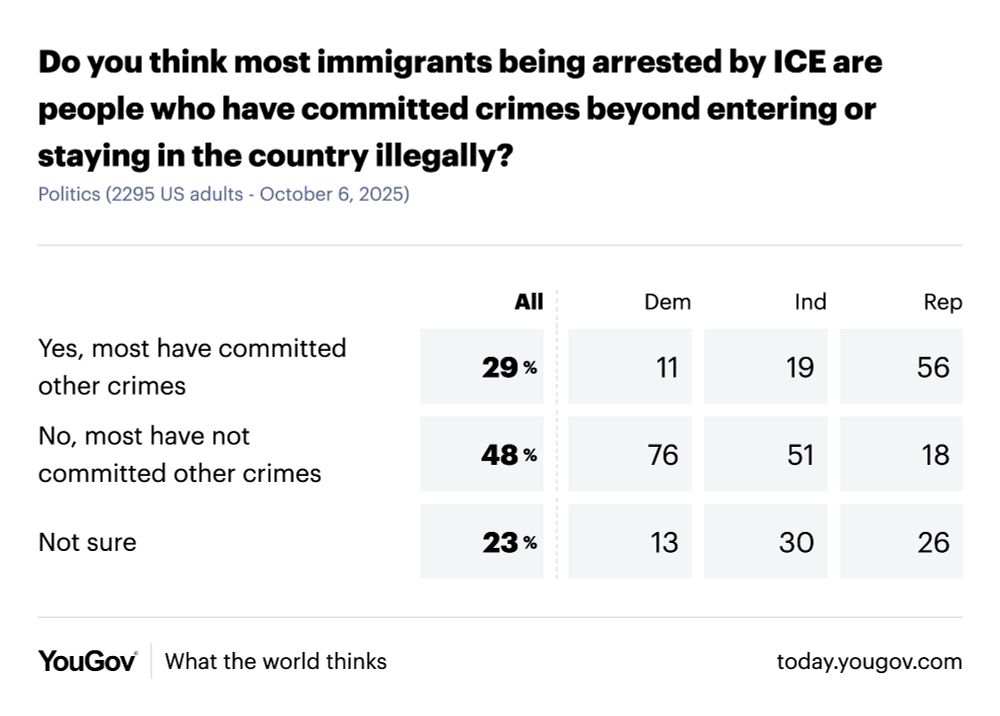
% who think most immigrants being arrested by ICE are people who have | haven't committed crimes beyond entering or staying in the country illegally
U.S. adults 29% | 48%
Democrats 11% | 76%
Independents 19% | 51%
Republicans 56% | 18%
today.yougov.com/topics/polit...
YouGov survey results by political party for the question, Do you think most immigrants being arrested by ICE are people who have committed crimes beyond entering or staying in the country illegally?
today.yougov.com
Oct 6 poll of 2,295 U.S. adults (+/-2.7%)
% who would describe the tactics currently used by ICE as [too forceful | not forceful enough]
U.S. adults 50% | 15%
Democrats 84% | 1%
Independents 52% | 11%
Republicans 14% | 31%
today.yougov.com/topics/polit...
YouGov survey results by political party for the question, How would you describe the tactics currently used by Immigration and Customs Enforcement (ICE)?
Reposted by YouGov America
opiniontoday.bsky.social
What do Americans think of Donald Trump’s and Gavin Newsom’s social media?
(@alxrh.bsky.social, @today.yougov.com)
More, via Opinion Today:
opiniontoday.substack.com/p/251005