Antoine Champreux
@toinechampreux.bsky.social
1.1K followers
330 following
22 posts
PhD - Global Ecology, Paleoecology, Paleobotany, Biogeography & Prehistory | vegetation modelling and spatial analyses
Deep-time to modern vegetation distribution 🌱 Megafauna extinctions | Neotropics after the Ice Age 🌎
Posts
Media
Videos
Starter Packs
Pinned

Reposted by Antoine Champreux


Reposted by Antoine Champreux
Martin Jung
@martinjung.eu
· Jul 1
Reviewing and benchmarking ecological modelling practices in the context of land use
Despite habitat loss and degradation are the primary drivers of biodiversity loss, different conclusions have been drawn about the importance of land-use or land-cover (LULC) change for biodiversity....
doi.org


Reposted by Antoine Champreux

Rupert Seidl
@rupertseidl.bsky.social
· Feb 24
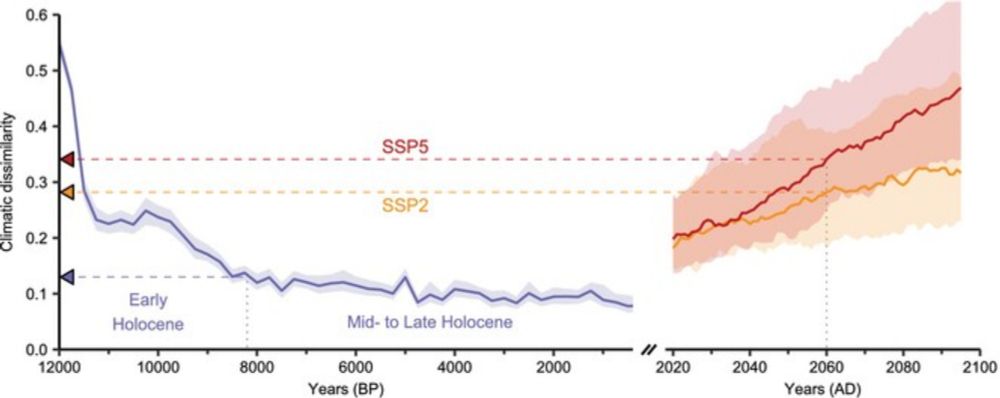
Paleorecords Reveal Biological Mechanisms Crucial for Reliable Species Range Shift Projections Amid Rapid Climate Change
Climate change has created an urgent need for reliable projections of species distributions. By hindcasting forest tree range shifts across Europe over the last 12,000 years, we show that process-exp...
doi.org
Reposted by Antoine Champreux
Nicolas Mouquet
@nmouquet.bsky.social
· Feb 12
Reposted by Antoine Champreux


Reposted by Antoine Champreux
Reposted by Antoine Champreux


Reposted by Antoine Champreux

Reposted by Antoine Champreux

Reposted by Antoine Champreux


Reposted by Antoine Champreux


Reposted by Antoine Champreux