


Sebastian Schmidt
@tsbschm.bsky.social
Lecturer in Microbiome & Health at @apcmicrobiomeirel.bsky.social & @ucc.bsky.social
Alumnus @borklab.bsky.social
Microbiome, microbial ecology & metagenomics.
Alumnus @borklab.bsky.social
Microbiome, microbial ecology & metagenomics.
prodigal has entered the chat.

January 27, 2026 at 8:59 AM
prodigal has entered the chat.
And here's a different view of the data, based on further categorization of samples. Each cell in the treemap corresponds to samples from one study.
I call this "The World according to Metagenomic Sampling Bias"
4/
I call this "The World according to Metagenomic Sampling Bias"
4/

January 13, 2026 at 4:33 PM
And here's a different view of the data, based on further categorization of samples. Each cell in the treemap corresponds to samples from one study.
I call this "The World according to Metagenomic Sampling Bias"
4/
I call this "The World according to Metagenomic Sampling Bias"
4/
The idea behind microntology is to slap multiple simple descriptive terms on a sample that together best describe it. Terms are introduced based on data availability.
We semi-manually annotated 305k publicly available metagenomes; n of samples per microntology term are shown in the plot.
3/
We semi-manually annotated 305k publicly available metagenomes; n of samples per microntology term are shown in the plot.
3/

January 13, 2026 at 4:33 PM
The idea behind microntology is to slap multiple simple descriptive terms on a sample that together best describe it. Terms are introduced based on data availability.
We semi-manually annotated 305k publicly available metagenomes; n of samples per microntology term are shown in the plot.
3/
We semi-manually annotated 305k publicly available metagenomes; n of samples per microntology term are shown in the plot.
3/
Hands down one of the best sentences ever written in a scientific Abstract.
And in @nature.com no less...
www.nature.com/articles/s41...
And in @nature.com no less...
www.nature.com/articles/s41...

January 10, 2026 at 3:18 PM
Hands down one of the best sentences ever written in a scientific Abstract.
And in @nature.com no less...
www.nature.com/articles/s41...
And in @nature.com no less...
www.nature.com/articles/s41...
There are several additional stories and refinements in the updated preprint, e.g. on possible reasons why some lineages remain unbinned (might have to do with GC content).
We have received thoughtful (and critical) feedback on the initial version and look forward to receiving more!
We have received thoughtful (and critical) feedback on the initial version and look forward to receiving more!

November 18, 2025 at 8:53 PM
There are several additional stories and refinements in the updated preprint, e.g. on possible reasons why some lineages remain unbinned (might have to do with GC content).
We have received thoughtful (and critical) feedback on the initial version and look forward to receiving more!
We have received thoughtful (and critical) feedback on the initial version and look forward to receiving more!
Similarly, species-rich phyla were dominated by large clades (low ρ), but w/ interesting outliers such as Patescibacteria.

November 18, 2025 at 8:53 PM
Similarly, species-rich phyla were dominated by large clades (low ρ), but w/ interesting outliers such as Patescibacteria.
ρ varied across habitats.
While deeper sampled habitats had lower ρ (as expected), there were interesting deviations from the trend: hot springs harbour more small clades than expected, the oral cavity is disproportionately dominated by large clades.
While deeper sampled habitats had lower ρ (as expected), there were interesting deviations from the trend: hot springs harbour more small clades than expected, the oral cavity is disproportionately dominated by large clades.

November 18, 2025 at 8:53 PM
ρ varied across habitats.
While deeper sampled habitats had lower ρ (as expected), there were interesting deviations from the trend: hot springs harbour more small clades than expected, the oral cavity is disproportionately dominated by large clades.
While deeper sampled habitats had lower ρ (as expected), there were interesting deviations from the trend: hot springs harbour more small clades than expected, the oral cavity is disproportionately dominated by large clades.
We tested these ideas on our large set of (data-driven and agnostically inferred) prokaryotic clades, and lo and behold: they follow Yule-Simon distributions, across taxonomic levels (from species per genus to classes per phylum).
x axis in plot is 'clade size' (i.e., n of subclades)
x axis in plot is 'clade size' (i.e., n of subclades)


November 18, 2025 at 8:53 PM
We tested these ideas on our large set of (data-driven and agnostically inferred) prokaryotic clades, and lo and behold: they follow Yule-Simon distributions, across taxonomic levels (from species per genus to classes per phylum).
x axis in plot is 'clade size' (i.e., n of subclades)
x axis in plot is 'clade size' (i.e., n of subclades)
>100 years ago, Willis (www.nature.com/articles/109...) famously observed that genus size distributions (n of species per genus) follow power laws in plants and animals, in what he called 'hollow curves'.


November 18, 2025 at 8:53 PM
>100 years ago, Willis (www.nature.com/articles/109...) famously observed that genus size distributions (n of species per genus) follow power laws in plants and animals, in what he called 'hollow curves'.

Together, these dbs allow one to address 'big' questions in microbial ecology & evolution with 'big' data, at unprecedented scales.
Give it a try, and feedback is always welcome!
Give it a try, and feedback is always welcome!

October 31, 2025 at 3:24 PM
Together, these dbs allow one to address 'big' questions in microbial ecology & evolution with 'big' data, at unprecedented scales.
Give it a try, and feedback is always welcome!
Give it a try, and feedback is always welcome!
[while the inner monologue goes...]

October 28, 2025 at 3:28 PM
[while the inner monologue goes...]
"As a scientist, how do you feel about the US Secretary of Health?"

October 28, 2025 at 3:25 PM
"As a scientist, how do you feel about the US Secretary of Health?"

“It’s more of a comment than a question…”

October 9, 2025 at 4:26 PM
“It’s more of a comment than a question…”
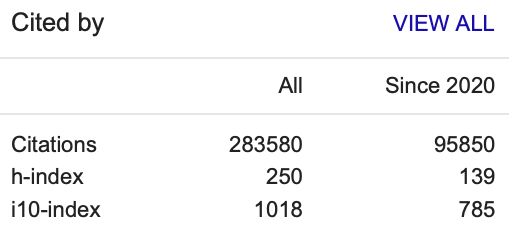
Fun party game idea.
Guess the researcher based on G Scholar citation stats:
Guess the researcher based on G Scholar citation stats:
August 5, 2025 at 12:42 PM
Fun party game idea.
Guess the researcher based on G Scholar citation stats:
Guess the researcher based on G Scholar citation stats:
Guilty as charged...
But also quite literally. I once put this as a biosketch into a talk:
But also quite literally. I once put this as a biosketch into a talk:

July 16, 2025 at 7:54 AM
Guilty as charged...
But also quite literally. I once put this as a biosketch into a talk:
But also quite literally. I once put this as a biosketch into a talk:
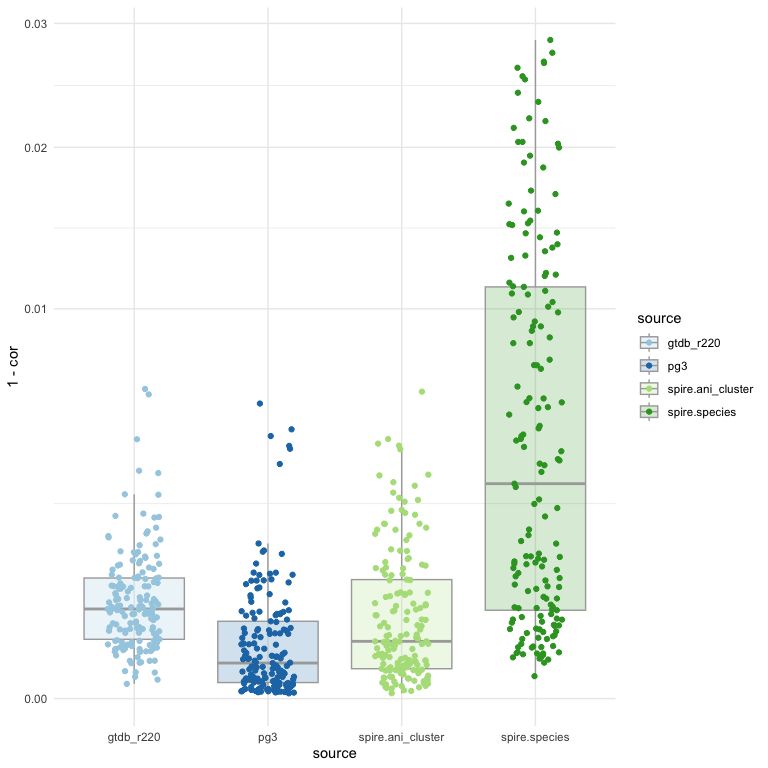
This is a view across marker genes when we go back with the inferred conversion factors (slopes) and re-predict species counts. Y axis is deviation (1 - rho).
NB: `spire.species` are GTDB classifications (only) for SPIRE MAGs, `spire.ani` is just 95% clusters of SPIRE MAGs as a "species" equiv.
NB: `spire.species` are GTDB classifications (only) for SPIRE MAGs, `spire.ani` is just 95% clusters of SPIRE MAGs as a "species" equiv.
July 1, 2025 at 6:34 AM
This is a view across marker genes when we go back with the inferred conversion factors (slopes) and re-predict species counts. Y axis is deviation (1 - rho).
NB: `spire.species` are GTDB classifications (only) for SPIRE MAGs, `spire.ani` is just 95% clusters of SPIRE MAGs as a "species" equiv.
NB: `spire.species` are GTDB classifications (only) for SPIRE MAGs, `spire.ani` is just 95% clusters of SPIRE MAGs as a "species" equiv.
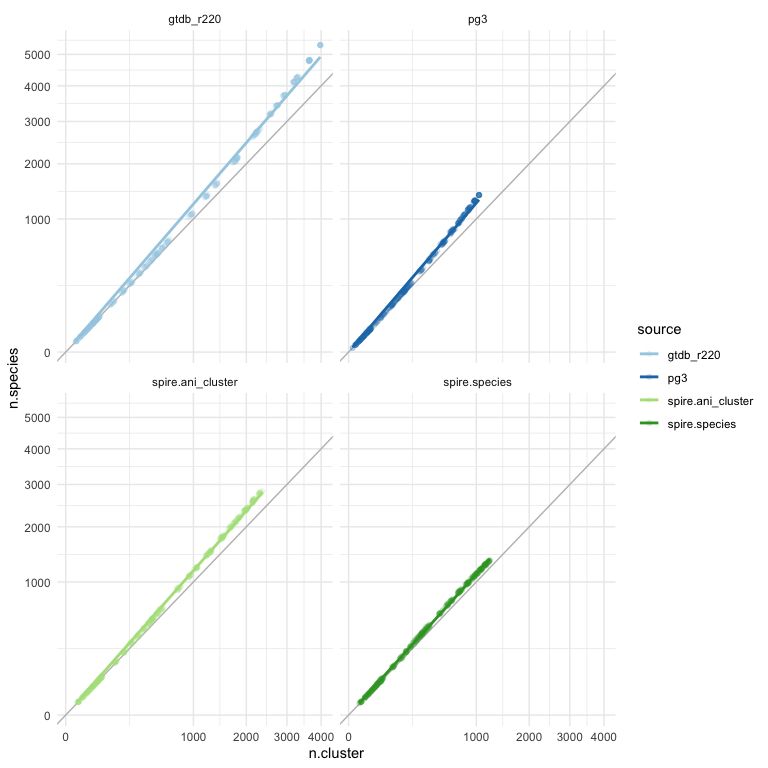
@benjwoodcroft.bsky.social so this is an example for a (random) archaeal marker. X axis is n of clusters, y axis is n of species; it's rarefied based on n of genomes considered. It's quite linear and quite close to slope=1 (give or take across markers).
July 1, 2025 at 6:34 AM
@benjwoodcroft.bsky.social so this is an example for a (random) archaeal marker. X axis is n of clusters, y axis is n of species; it's rarefied based on n of genomes considered. It's quite linear and quite close to slope=1 (give or take across markers).
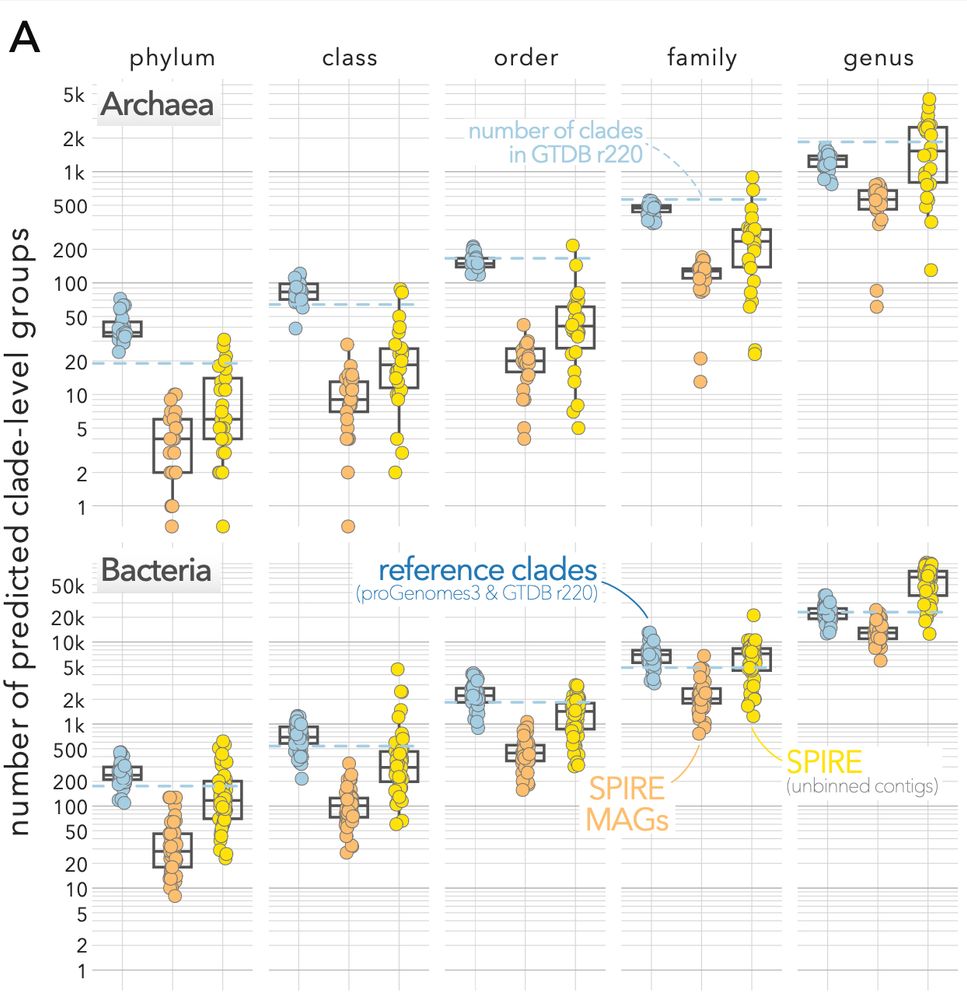
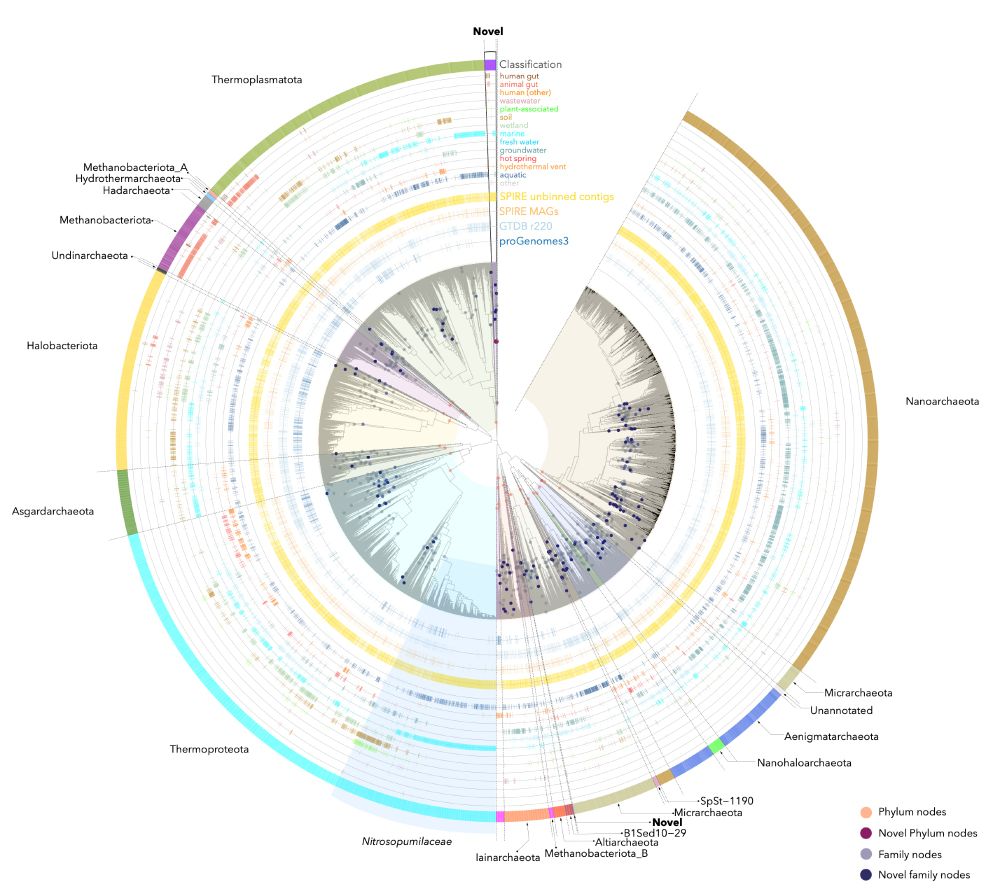
We estimate that ~10 novel archaeal and ~145 bacterial phyla are "hiding" among the unbinned contigs. This corresponds to an increase of ~50% and ~83% relative to ref dbs.
For genera, we find that >3 novel genera are discoverable per each recognized genus in the reference.
For genera, we find that >3 novel genera are discoverable per each recognized genus in the reference.
June 27, 2025 at 8:10 PM
We estimate that ~10 novel archaeal and ~145 bacterial phyla are "hiding" among the unbinned contigs. This corresponds to an increase of ~50% and ~83% relative to ref dbs.
For genera, we find that >3 novel genera are discoverable per each recognized genus in the reference.
For genera, we find that >3 novel genera are discoverable per each recognized genus in the reference.
Finally, we built >130 large marker gene phylogenies and cut them at relative evolutionary divergence (RED) levels corresponding to phylum-, class-, order-, family- and genus-level clades.
(dots in the plot below indicate phyla and families)
(dots in the plot below indicate phyla and families)
June 27, 2025 at 8:10 PM
Finally, we built >130 large marker gene phylogenies and cut them at relative evolutionary divergence (RED) levels corresponding to phylum-, class-, order-, family- and genus-level clades.
(dots in the plot below indicate phyla and families)
(dots in the plot below indicate phyla and families)
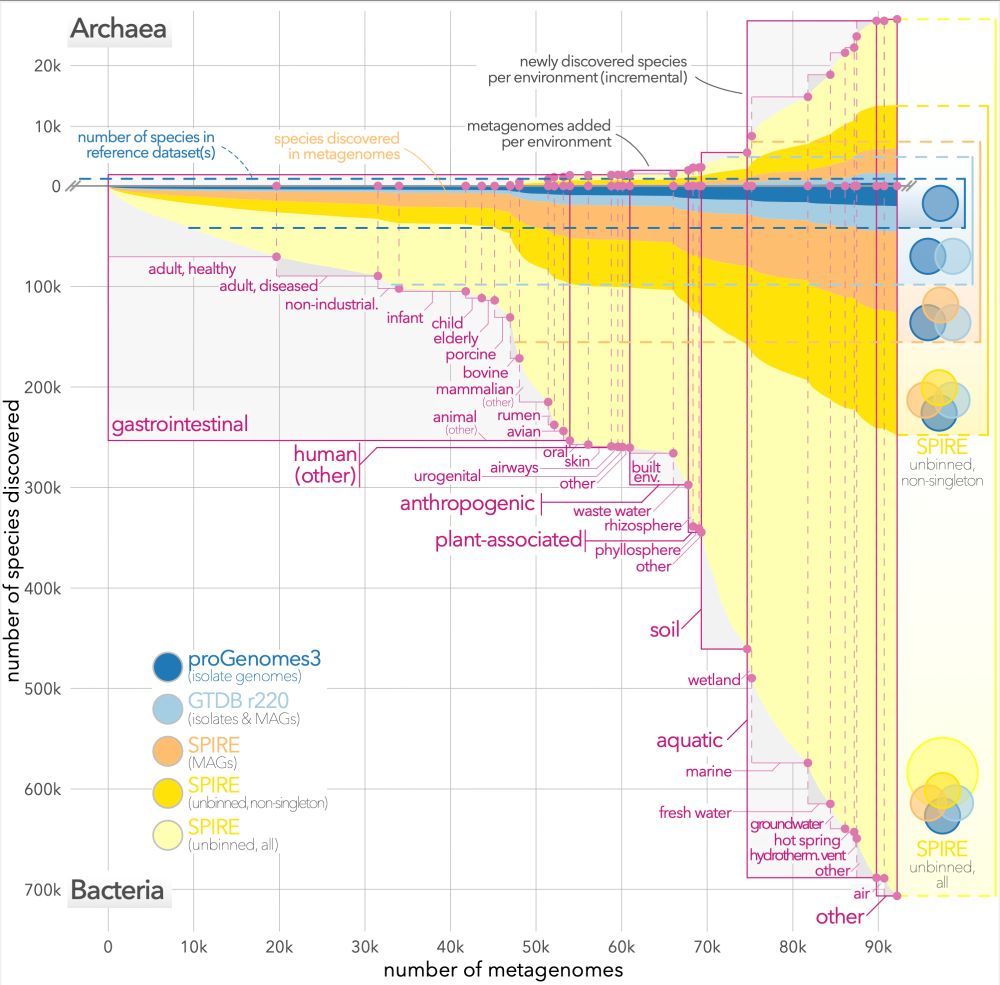
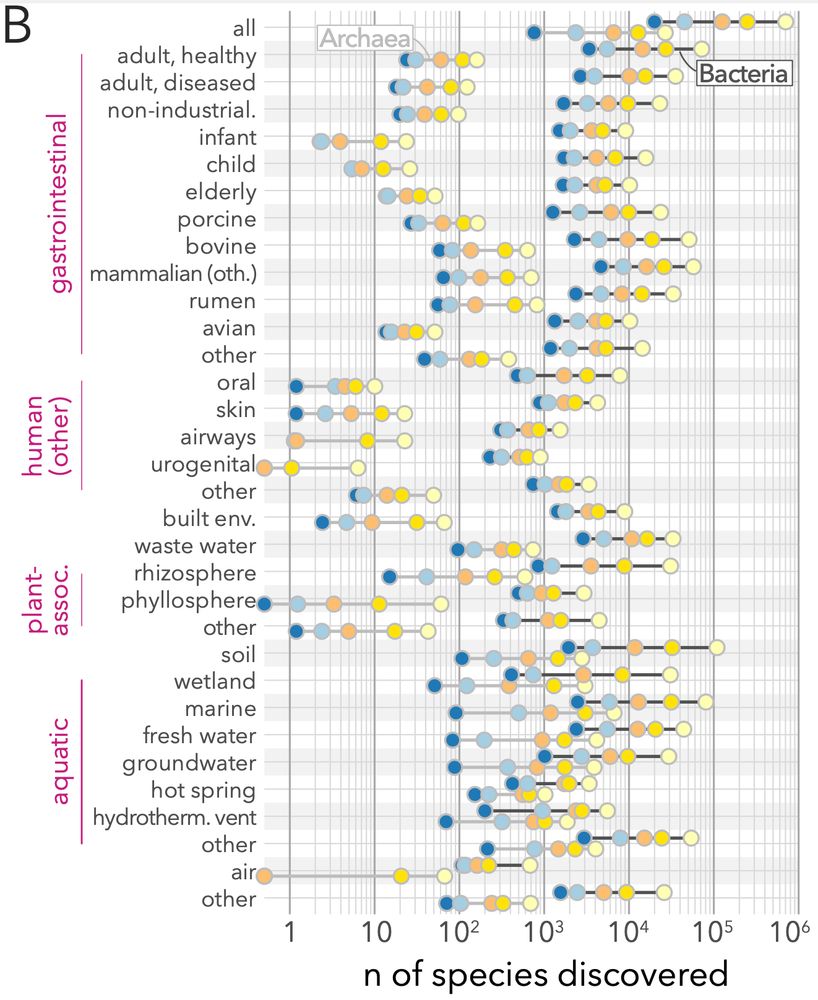
This becomes even clearer in an "incremental" rarefaction analysis. Although human-assoc and gut samples account for >2/3 of samples in the survey, they only contribute 1/3 of total discovered diversity.
Most unbinned species species lurk among soil, aquatic & wetland samples.
Most unbinned species species lurk among soil, aquatic & wetland samples.
June 27, 2025 at 8:10 PM
This becomes even clearer in an "incremental" rarefaction analysis. Although human-assoc and gut samples account for >2/3 of samples in the survey, they only contribute 1/3 of total discovered diversity.
Most unbinned species species lurk among soil, aquatic & wetland samples.
Most unbinned species species lurk among soil, aquatic & wetland samples.
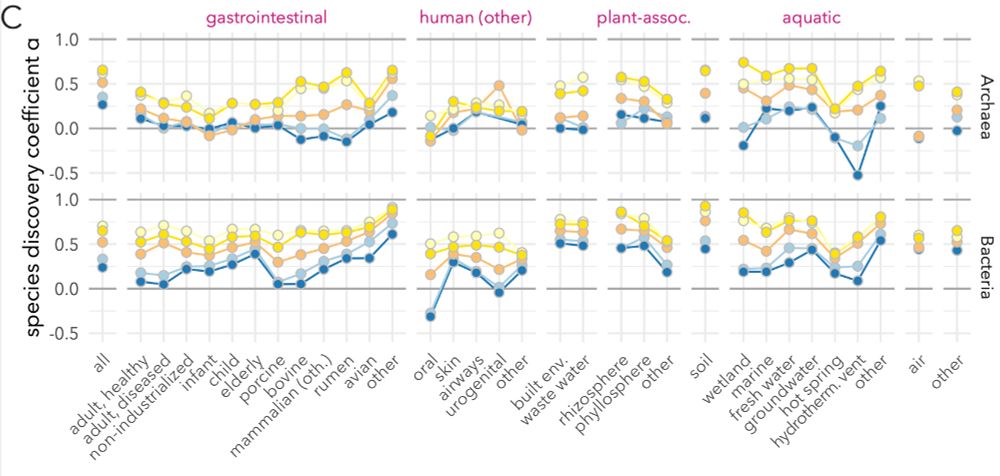
Given SPIRE's curated sample annotations, we broke these numbers down by habitat. We calcualted a 'species discovery coefficient' α.
Few habitats show signes of saturation (no new sp. added as more samples come in, α≤0). Most, in particular soils & aquatic envs, remain in full discovery swing.
Few habitats show signes of saturation (no new sp. added as more samples come in, α≤0). Most, in particular soils & aquatic envs, remain in full discovery swing.
June 27, 2025 at 8:10 PM
Given SPIRE's curated sample annotations, we broke these numbers down by habitat. We calcualted a 'species discovery coefficient' α.
Few habitats show signes of saturation (no new sp. added as more samples come in, α≤0). Most, in particular soils & aquatic envs, remain in full discovery swing.
Few habitats show signes of saturation (no new sp. added as more samples come in, α≤0). Most, in particular soils & aquatic envs, remain in full discovery swing.
After clustering these to (calibrated) species-level groups for each marker, we could then build "species discovery" (or rarefaction) curves across 92k metagenomes from SPIRE.
We estimate that ~702k bacterial and ~27k archaeal species are "discoverable" in total in these contigs.
We estimate that ~702k bacterial and ~27k archaeal species are "discoverable" in total in these contigs.

June 27, 2025 at 8:10 PM
After clustering these to (calibrated) species-level groups for each marker, we could then build "species discovery" (or rarefaction) curves across 92k metagenomes from SPIRE.
We estimate that ~702k bacterial and ~27k archaeal species are "discoverable" in total in these contigs.
We estimate that ~702k bacterial and ~27k archaeal species are "discoverable" in total in these contigs.
When yet another 16S-based paper discusses analyses of “strains”.

June 19, 2025 at 11:08 AM
When yet another 16S-based paper discusses analyses of “strains”.