


Barry Pollard
@tunetheweb.com
Web Performance Developer Advocate at Google Chrome helping to make the web go faster! All opinions my own.
The 2025 State of HTML survey is out
2025.stateofhtml.com
And I love the opening stat — Lazy Loading FTW!
Built-in, simple to use, attributes and elements are HTML's super power. And you can see that reflect in other attributes with the largest increase (details/summary, dialog, fetchpriority!)
2025.stateofhtml.com
And I love the opening stat — Lazy Loading FTW!
Built-in, simple to use, attributes and elements are HTML's super power. And you can see that reflect in other attributes with the largest increase (details/summary, dialog, fetchpriority!)


December 16, 2025 at 9:26 AM
The 2025 State of HTML survey is out
2025.stateofhtml.com
And I love the opening stat — Lazy Loading FTW!
Built-in, simple to use, attributes and elements are HTML's super power. And you can see that reflect in other attributes with the largest increase (details/summary, dialog, fetchpriority!)
2025.stateofhtml.com
And I love the opening stat — Lazy Loading FTW!
Built-in, simple to use, attributes and elements are HTML's super power. And you can see that reflect in other attributes with the largest increase (details/summary, dialog, fetchpriority!)
The other thing I see is comparisons to game development which can render at the full speed of monitors—e.g. 120 fps, or even higher! That's nice, and browsers can get close for non-JS rendering.
Check out this for a real cool example! (at 60fps):
x.com/pushmatrix/s...
9/12
Check out this for a real cool example! (at 60fps):
x.com/pushmatrix/s...
9/12
December 9, 2025 at 12:33 PM
The other thing I see is comparisons to game development which can render at the full speed of monitors—e.g. 120 fps, or even higher! That's nice, and browsers can get close for non-JS rendering.
Check out this for a real cool example! (at 60fps):
x.com/pushmatrix/s...
9/12
Check out this for a real cool example! (at 60fps):
x.com/pushmatrix/s...
9/12
But you can also see the "processing duration" of the largest INP interaction by hovering, and each one by expanding.
But, as I say, input delay can be other JS running, and presentation delay can also be under the devs control—somewhat. Especially for things like typing.
8/12
But, as I say, input delay can be other JS running, and presentation delay can also be under the devs control—somewhat. Especially for things like typing.
8/12

December 9, 2025 at 12:33 PM
But you can also see the "processing duration" of the largest INP interaction by hovering, and each one by expanding.
But, as I say, input delay can be other JS running, and presentation delay can also be under the devs control—somewhat. Especially for things like typing.
8/12
But, as I say, input delay can be other JS running, and presentation delay can also be under the devs control—somewhat. Especially for things like typing.
8/12
Did my own take on this.
I love the way AI really enhances the product and makes it 10x more useful...
I love the way AI really enhances the product and makes it 10x more useful...

December 4, 2025 at 1:27 PM
Did my own take on this.
I love the way AI really enhances the product and makes it 10x more useful...
I love the way AI really enhances the product and makes it 10x more useful...
Oh I’ve spent my afternoon dealing with an ungodly amount of lights. And three very excitable young children who not so much decorated the tree as vomited Christmas decorations upon it.

November 29, 2025 at 5:09 PM
Oh I’ve spent my afternoon dealing with an ungodly amount of lights. And three very excitable young children who not so much decorated the tree as vomited Christmas decorations upon it.
These are in Chrome Canary already.
Firefox and Safari Tech Preview have paintTime but not presentationTime. FF are working on it IIRC, but Safari's rendering pipeline is a bit different so even if they do add that, it'll likely be a bit earlier than when pixels actually hit the screen.
3/4
Firefox and Safari Tech Preview have paintTime but not presentationTime. FF are working on it IIRC, but Safari's rendering pipeline is a bit different so even if they do add that, it'll likely be a bit earlier than when pixels actually hit the screen.
3/4


November 27, 2025 at 3:03 PM
These are in Chrome Canary already.
Firefox and Safari Tech Preview have paintTime but not presentationTime. FF are working on it IIRC, but Safari's rendering pipeline is a bit different so even if they do add that, it'll likely be a bit earlier than when pixels actually hit the screen.
3/4
Firefox and Safari Tech Preview have paintTime but not presentationTime. FF are working on it IIRC, but Safari's rendering pipeline is a bit different so even if they do add that, it'll likely be a bit earlier than when pixels actually hit the screen.
3/4

A quick check shows they are using AWS via Atlassian for me:

November 18, 2025 at 5:56 PM
A quick check shows they are using AWS via Atlassian for me:
Chrome 143 will start rolling out today (most users get it next week).
It includes a new set of options for your webperf traces — including saving sources & source maps:
developer.chrome.com/docs/devtool...
This makes it easier for those viewing traces outside of the page load to get more context.
It includes a new set of options for your webperf traces — including saving sources & source maps:
developer.chrome.com/docs/devtool...
This makes it easier for those viewing traces outside of the page load to get more context.

November 18, 2025 at 5:10 PM
Chrome 143 will start rolling out today (most users get it next week).
It includes a new set of options for your webperf traces — including saving sources & source maps:
developer.chrome.com/docs/devtool...
This makes it easier for those viewing traces outside of the page load to get more context.
It includes a new set of options for your webperf traces — including saving sources & source maps:
developer.chrome.com/docs/devtool...
This makes it easier for those viewing traces outside of the page load to get more context.

November 18, 2025 at 1:15 PM
That makes me cry! Luckily it's fixed on Chrome Canary

November 18, 2025 at 11:24 AM
That makes me cry! Luckily it's fixed on Chrome Canary
On a related note, have you seen full split browsing mode yet?

November 1, 2025 at 12:50 PM
On a related note, have you seen full split browsing mode yet?
Q1. Yup. Hopefully you saw the NOT part of WHERE rules in my talk:
developer.chrome.com/docs/web-pla...
Q2. Yup.
developer.chrome.com/docs/web-pla...
developer.chrome.com/docs/web-pla...
Q2. Yup.
developer.chrome.com/docs/web-pla...

October 31, 2025 at 2:45 PM
Q1. Yup. Hopefully you saw the NOT part of WHERE rules in my talk:
developer.chrome.com/docs/web-pla...
Q2. Yup.
developer.chrome.com/docs/web-pla...
developer.chrome.com/docs/web-pla...
Q2. Yup.
developer.chrome.com/docs/web-pla...
I also extracted the version out of curiosity (in the same sheet)

October 16, 2025 at 10:16 PM
I also extracted the version out of curiosity (in the same sheet)
We want to congratulate @firefox.com and @firefoxperformance.bsky.social for shipping the Event Timing API in Firefox 144, meaning both INP (which is calculated from Event Timing) and LCP (that they shipped previously) can be measured in that browser. More Core Web Vitals for all!
5/7
5/7

October 14, 2025 at 5:21 PM
We want to congratulate @firefox.com and @firefoxperformance.bsky.social for shipping the Event Timing API in Firefox 144, meaning both INP (which is calculated from Event Timing) and LCP (that they shipped previously) can be measured in that browser. More Core Web Vitals for all!
5/7
5/7

React 19.2 has shipped including support for the DevTools Extensibility API so you can understand what React is doing when, and how that relates to the rest of the performance profile 🥳 🎉
react.dev/blog/2025/10...
react.dev/blog/2025/10...

October 2, 2025 at 10:47 AM
React 19.2 has shipped including support for the DevTools Extensibility API so you can understand what React is doing when, and how that relates to the rest of the performance profile 🥳 🎉
react.dev/blog/2025/10...
react.dev/blog/2025/10...
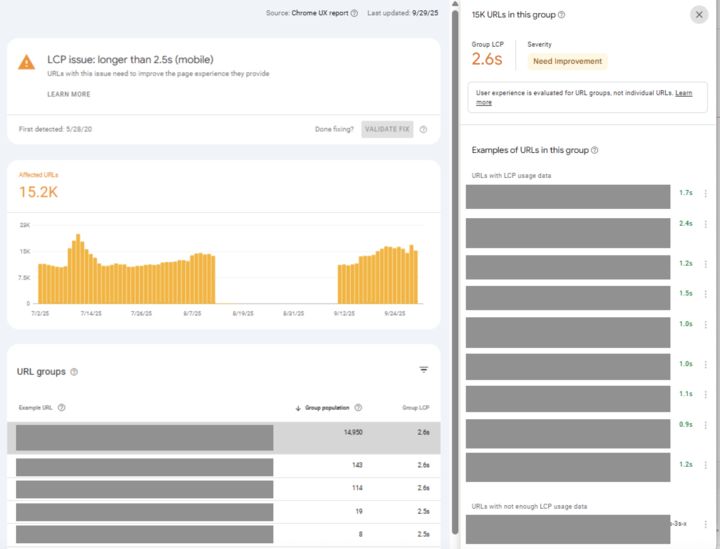
Core Web Vitals mystery for ya:
Why does Google Search Console same my LCP is bad, but every example URL has good LCP?
I see developers asking: How can this happen? Is GSC wrong? (I'm willing to bet it is not!) What can you do about it?
This is admittedly confusing so let's dive in...
🧵 1/12
Why does Google Search Console same my LCP is bad, but every example URL has good LCP?
I see developers asking: How can this happen? Is GSC wrong? (I'm willing to bet it is not!) What can you do about it?
This is admittedly confusing so let's dive in...
🧵 1/12
October 1, 2025 at 1:36 PM
Core Web Vitals mystery for ya:
Why does Google Search Console same my LCP is bad, but every example URL has good LCP?
I see developers asking: How can this happen? Is GSC wrong? (I'm willing to bet it is not!) What can you do about it?
This is admittedly confusing so let's dive in...
🧵 1/12
Why does Google Search Console same my LCP is bad, but every example URL has good LCP?
I see developers asking: How can this happen? Is GSC wrong? (I'm willing to bet it is not!) What can you do about it?
This is admittedly confusing so let's dive in...
🧵 1/12
Drew this today to explain where we are on the AI hype cycle at the moment. Feel free to use…

September 26, 2025 at 12:40 PM
Drew this today to explain where we are on the AI hype cycle at the moment. Feel free to use…
And very amusing that “Friendly” option isn’t really an option 🤣

September 23, 2025 at 11:23 AM
And very amusing that “Friendly” option isn’t really an option 🤣
I’d rather they were more honest and just said why they use cookies, why that’s needed, and offer Accept All, Reject All or Customize options.
Kinda like this one:
Kinda like this one:

August 27, 2025 at 10:55 PM
I’d rather they were more honest and just said why they use cookies, why that’s needed, and offer Accept All, Reject All or Customize options.
Kinda like this one:
Kinda like this one:
Two pro webperf tips!
Are you using Annotations in your performance traces?
developer.chrome.com/docs/devtool...
And even when not needing to annotate, Gemini AI auto-annotations can quickly give you an idea what a bit of the flame chart is doing without you needing to dig in yourself. Try it out!
Are you using Annotations in your performance traces?
developer.chrome.com/docs/devtool...
And even when not needing to annotate, Gemini AI auto-annotations can quickly give you an idea what a bit of the flame chart is doing without you needing to dig in yourself. Try it out!
August 18, 2025 at 3:43 PM
Two pro webperf tips!
Are you using Annotations in your performance traces?
developer.chrome.com/docs/devtool...
And even when not needing to annotate, Gemini AI auto-annotations can quickly give you an idea what a bit of the flame chart is doing without you needing to dig in yourself. Try it out!
Are you using Annotations in your performance traces?
developer.chrome.com/docs/devtool...
And even when not needing to annotate, Gemini AI auto-annotations can quickly give you an idea what a bit of the flame chart is doing without you needing to dig in yourself. Try it out!
🇮🇪 C(ORK) 🛫 LHR 🛬 PVG 🇨🇳
Barely home long enough to repack, I’m back at work and on the road again. This time I’m off to Shanghai for Google I/O Connect China 2025! Say hi if you’re going.
Barely home long enough to repack, I’m back at work and on the road again. This time I’m off to Shanghai for Google I/O Connect China 2025! Say hi if you’re going.

August 11, 2025 at 5:09 AM
🇮🇪 C(ORK) 🛫 LHR 🛬 PVG 🇨🇳
Barely home long enough to repack, I’m back at work and on the road again. This time I’m off to Shanghai for Google I/O Connect China 2025! Say hi if you’re going.
Barely home long enough to repack, I’m back at work and on the road again. This time I’m off to Shanghai for Google I/O Connect China 2025! Say hi if you’re going.
Staring at it right now! Sadly won’t have time as have ziplining booked and also a training booking later.
August 8, 2025 at 11:42 AM
Staring at it right now! Sadly won’t have time as have ziplining booked and also a training booking later.
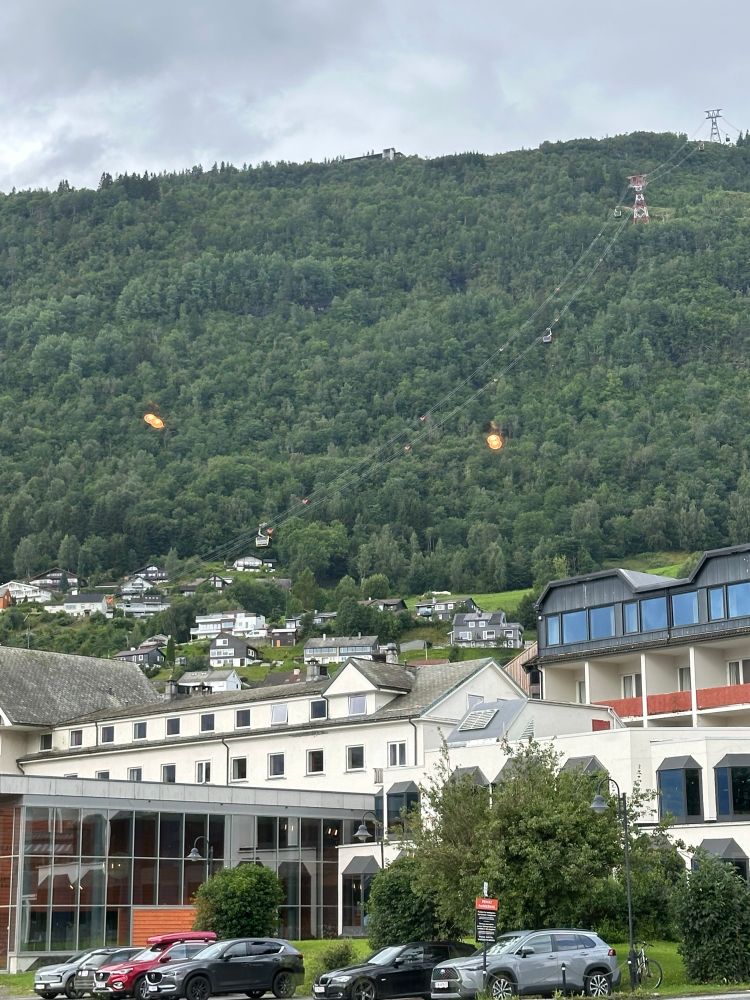
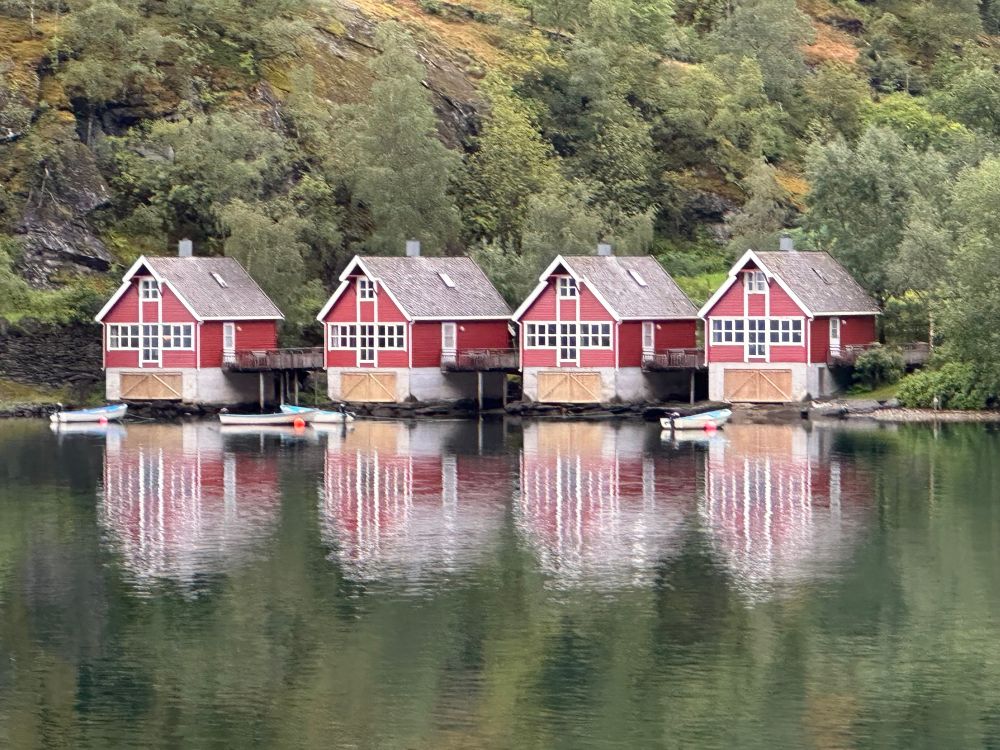
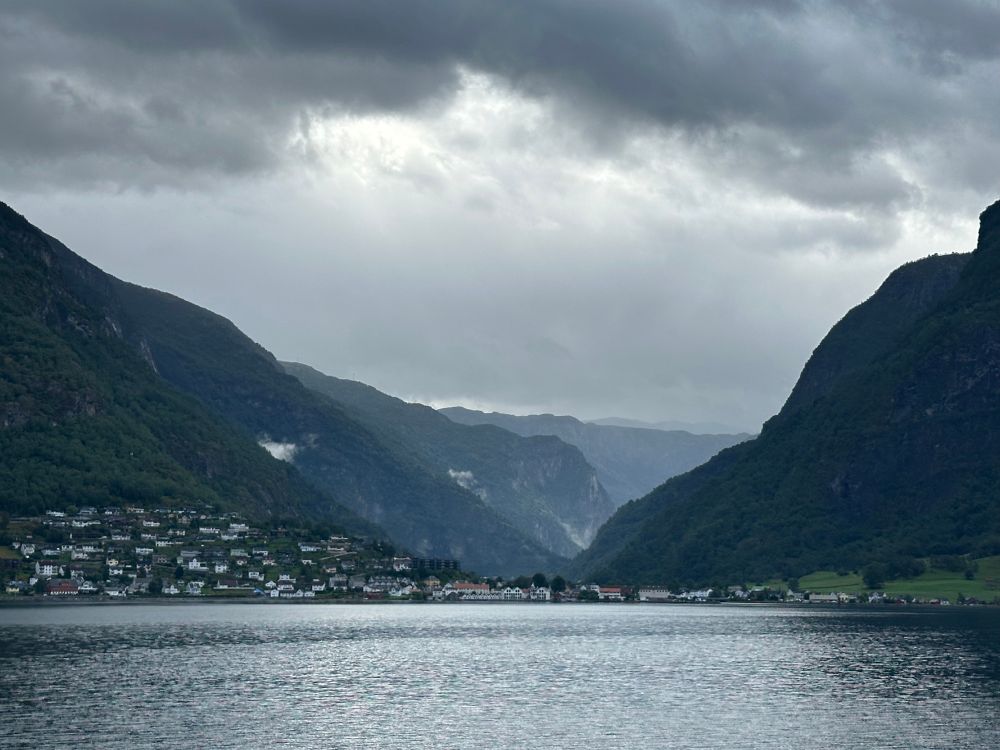
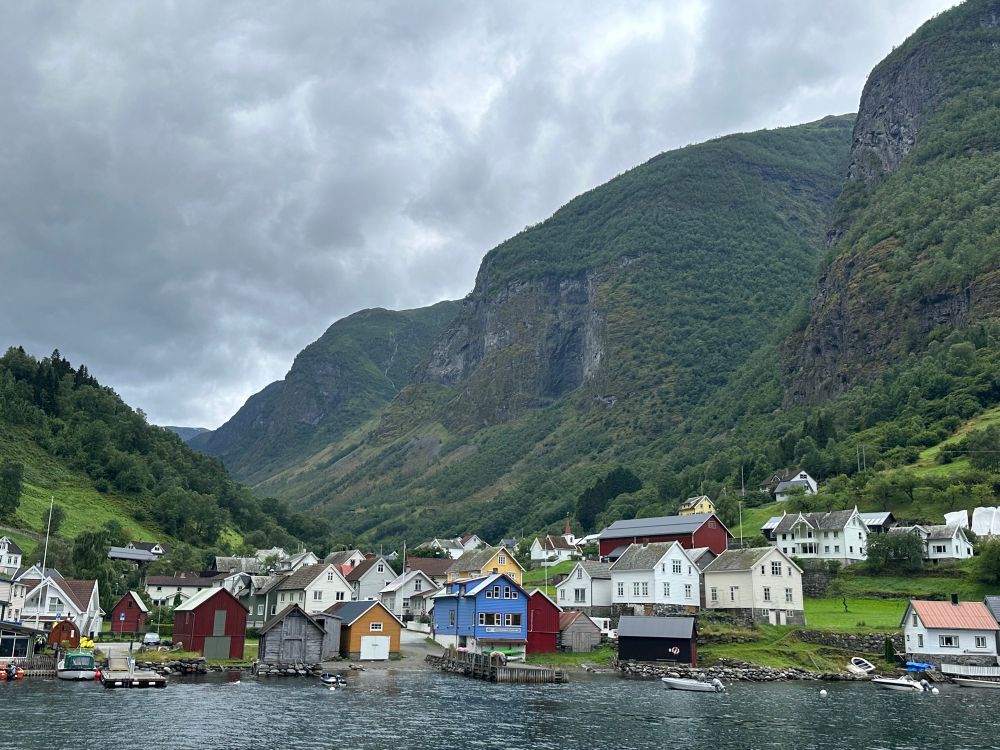
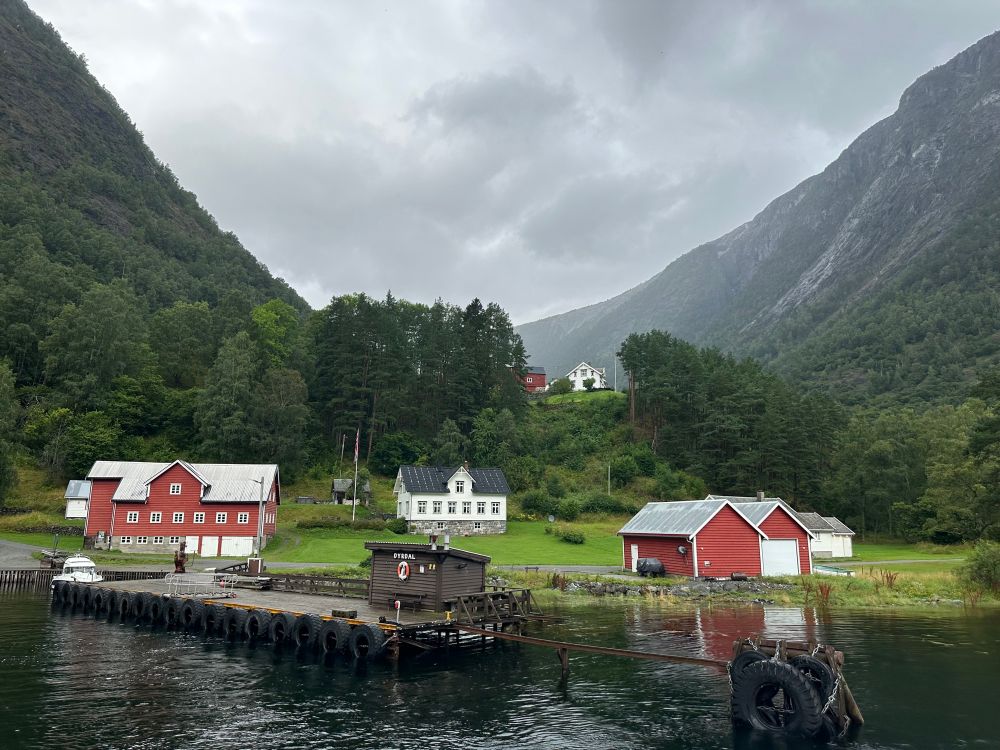
Since you all seemed to appreciate the other photos, here some more from the Fjord cruise.
Oh and btw kids are enjoying themselves! And I do get an occasional “wow” or “cool”. They’re just not quite as enthralled as I am by the views! 😀
Oh and btw kids are enjoying themselves! And I do get an occasional “wow” or “cool”. They’re just not quite as enthralled as I am by the views! 😀
August 8, 2025 at 9:58 AM
Since you all seemed to appreciate the other photos, here some more from the Fjord cruise.
Oh and btw kids are enjoying themselves! And I do get an occasional “wow” or “cool”. They’re just not quite as enthralled as I am by the views! 😀
Oh and btw kids are enjoying themselves! And I do get an occasional “wow” or “cool”. They’re just not quite as enthralled as I am by the views! 😀