Colin Angus
@victimofmaths.bsky.social
7K followers 360 following 730 posts
Professor of Alcohol Policy in the Sheffield Addictions Research Group (@SARG-SCHARR), graph drawer, data botherer, cake eater, incompetent cyclist and intermittent birder.
Posts Media Videos Starter Packs
Reposted by Colin Angus
victimofmaths.bsky.social
Per 100,000 people *in that age group*.
victimofmaths.bsky.social
We also estimate that there are 7,426 hospital admissions in NI each year caused by alcohol, costing the NHS almost £19m, of which nearly 1/4 comes from the cost of treating alcohol-attributable cancers.

More details (and graphs) in the report.
victimofmaths.bsky.social
We estimate that over 2/3 (69.7%) of deaths caused by alcohol in NI are among men, with a particularly strong male bias for alcohol-related injury deaths, and 43.6% are in the over 65s, although alcohol-specific deaths are more common in 45-54 and 55-64 year-olds.
A bar chart showing the data from the previous post's bar chart separated by sex. The male bars are around twice the length of the female bars for all condition groups except for injuries, where the difference is far larger as men are much more likely to get injured while intoxicated. She same chart again, but broken down by age groups this time. Cancers, CVD, digestive diseases and other chronic conditions follow a similar pattern, with many more alcohol-attributable deaths in the oldest (65+) age group. Injuries still have more deaths in the oldest age group, but relatively higher counts in all younger age groups. Alcohol-specific deaths are different, with the largest counts in 55-64 year olds and 45-54 year olds
victimofmaths.bsky.social
We estimate that 676 people lose their life each year in Northern Ireland as a direct result of their alcohol consumption. The largest contributor to this are alcohol-specific causes (largely ARLD), but we estimate 127 cancer deaths and 74 CVD deaths each year are caused by alcohol.
A bar chart showing the estimated number of deaths in Northern Ireland each year caused directly by alcohol broken downby cause. Alcohol-specific (341 deaths), cancers (127), cardiovascular disease (74), digestive diseases (35), injuries (74) and other chronic conditions (24).
victimofmaths.bsky.social
We've got a new report out today using new data from Northern Ireland to estimate Alcohol-Attributable Fractions (AAFs) and the number of hospital admissions and deaths each year in NI caused by alcohol. Plus, how these break down by age, sex and condition.

sarg-sheffield.ac.uk/wp-content/u...
A picture of the (not very exciting) front cover of the report: Estimating the burden of alcohol on the health of Northern Ireland. Dated September 2025 and written by me. A lollipop chart showing the proportion of deaths from a range of causes related to alcohol (e.g. breast cancer, ischaemic heart disease, liver cirrhosis, fall injuries, lower respiratory tract infactions) in both men and women. The largest proportion is for liver cirrhosis and all conditions except breast cancer have higher proportions for men than women. A bar chart showing the estimated number of annual deaths in Northern Ireland that are caused by alcohol from a range of different health conditions. The conditions are the same as in the previous plot, but with the addition of 4 conditions which are wholly caused by alcohol (e.g. alcohol-related liver disease/ARLD). ARLD is by far the longest bar with almost 250 deaths per year.
victimofmaths.bsky.social
We've got a shiny new report (full of lovely graphs) all about the no/low alcohol drinks market in Great Britain. How big is the market compared to for standard alcohol and how has it grown recently, how do prices compare, who drinks these products etc. We've got answers to all these questions:
sarg-scharr.bsky.social
Lots of media coverage this morning of findings from our new report 'Alcohol-free and low-alcohol drinks in Great Britain: Monitoring report on 2023 data'. The no/lo market continues to expand and no/lo drinks are more likely to be consumed by risky drinkers. Find out more 👇 @nihr.bsky.social
New report reveals further growth and key trends in alcohol-free and low-alcohol drinks market - Sheffield Addictions Research Group
A second Monitoring Report from the Sheffield Addictions Research Group has been published, revealing further growth in the alcohol-free and low-alcohol (no/lo) drinks market and offering new insights...
sarg-sheffield.ac.uk
victimofmaths.bsky.social
For both alcohol and drugs, however, the biggest falls in 2024 came in the age groups with the highest rates. Which can only be a good thing.
victimofmaths.bsky.social
Last chart for now - an update to this comparison of age trends in drug and alcohol deaths in Scotland.

As much as the population rates are similar for both causes, the age patterns are *very* different, with drug deaths peaking in the 40s and alcohol deaths in the 60s.
A series of small multiple line charts, each showing the comparative trend in alcohol-specific and drug-related deaths in Scotland from 2001-2024. Drug deaths dominate in the under 50s, alcohol deaths in the over 55s.
victimofmaths.bsky.social
A couple of bonus graphs - comparing today's alcohol-specific death figures for Scotland, with drug-related deaths trends published last month. The good news is that both fell in 2024, although drug-related deaths remain *way* above their levels 20 years ago.
victimofmaths.bsky.social
2) These figures are only those deaths that are definitively caused by alcohol (i.e. deaths from causes which cannot happen in the absence of alcohol). So they significantly undercount the full burden of alcohol, as drinking increases your risks of many chronic diseases not included in these numbers
victimofmaths.bsky.social
A few important points:
1) Scotland raised the MUP threshold forom 50p to 65p in September 2024. So that will be partially reflected in these new figures, but only partially. It will be interesting to see if the 2025 figures show a bigger fall as a result.
victimofmaths.bsky.social
We don't have 2024 figures for England yet, so we can't compare, but I'd be surprised if they were this positive. Last year we saw the North East of England overtake Scotland's alcohol-specific death rate. I'd be surprised if that wasn't still true in 2024.
A busy line chart showing the trend in alcohol-specific deaths for the UK nations and every region of England. Scotland was around double the rate of anywhere else in the UK in the early 2000s, but rates in Northern Ireland and the North of England have risen sharply during the pandemic and the North East overtook Scotland in 2023.
victimofmaths.bsky.social
Maybe the most positive news in today's data is the sharp fall in alcohol-specific deaths in people in their 60s and 70s (which are now the heaviest drinking age groups).

Deaths have been rising in these groups since the early 2010s, so it's good to see that trend reversed.
A series of small line charts showing the age-specific trends in alcohol-specific deaths. Ages 40-64 had the highest rates in the early 2000s, then saw a dramatic fall in the early 2010s, and a plateau since. Ages 65+ didn't have the same dramatic peak, but have seen steady increases since the early 2010s, interrupted by a brief drop in 2019 following the introduction of MUP, then resuming in 2020. Ages 60-79 have seen he biggest fall in deaths in 2024, suggesting this gradual rise may be starting to reverse. Hopefully.
victimofmaths.bsky.social
Another positive is that the biggest fall in 2024 was in the most deprived groups. There are still stark inequalities in alcohol harms in Scotland - 4.5 times more deaths in the most deprived vs. least deprived groups. But this is massive progress from 8 times more 20 years ago.
Another line chart, this one showing trends in age-standardised alcohol-specific death rates by deprivation quintile. The most deprived quintile has much higher death rates, but has also seen the biggest fall in 2024.
victimofmaths.bsky.social
Separating by sex shows some interesting differences. Unsurprisingly alcohol-specific death rates are much lower in women, but the sharp dip following MUP, and the large increase during the pandemic are both much more pronounced among men.

Rates fell in both in 2024 though, which is positive.
A similar line chart to the previous post, but separated by sex. Males have much higher rates - more than double those of women - and with much greater variability over time (a bigger early 00s peak, bigger fall in 2019 and bigger pandemic-related increase). Both fell in 2024 though.
victimofmaths.bsky.social
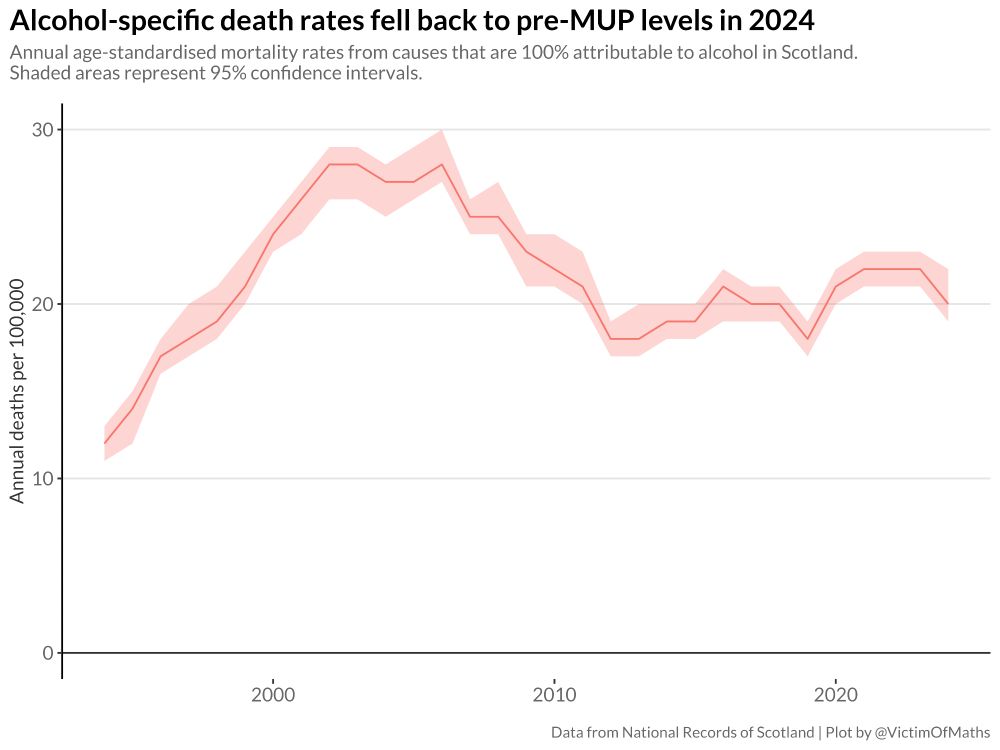
New figures from National Records of Scotland out today show that alcohol-specific deaths in Scotland fell by 7% to their lowest level since 2019, and are now back in a similar place to where they were before the introduction of Minimum Unit Pricing in 2018.

This is obviously good news...🧵
A line chart showing age-standardised rates of alcohol-specific deaths in Scotland from 1994-2024. The trend shows a massive rise until the early 2000s, a significant fall until the early 2010s, then a gradual rise, a brief drop in 2019 following the introduction of MUP and then a pandemic 'bump', with 2024 showing the first drop at the (hopefully) tail of this.
victimofmaths.bsky.social
Ultimately, our findings suggest that the actions in the 10-year plan may not do much to reduce alcohol harm without some further action beyond just growing the size of the no/lo market.

This work links to a big ongoing project about no/lo drinks: sarg-sheffield.ac.uk/projects/no-...
No/Lo Project - Sheffield Addictions Research Group
The No/Lo Project investigates whether non-alcoholic or low-alcohol drinks can improve people’s health. These drinks are beers, ciders, wines, spirits that are alcohol-free or contain a little alcohol...
sarg-sheffield.ac.uk
victimofmaths.bsky.social
Obviously the biggest public health benefits come from reducing the drinking of the heaviest drinkers. So this study suggests that no/lo products might have more limited potential for this group, unless we can come up with some cunning strategies to encourage heavier drinkers to switch to no/lo.
victimofmaths.bsky.social
However, we also know that people who drink to conform are less likely to be heavy drinkers (again, perhaps not that surprisingly). So growing the no/lo market might benefit this group, but that's not likely to make that much difference to the drinking of heavier drinkers.
victimofmaths.bsky.social
Intuitively this makes sense - if you're only drinking to fit in, it's easy to see how a no/lo alcohol option could fulfil that purpose. Whereas it's harder to see how people drinking for the sensation of being tipsy or to cope with their problems can get the same thing from no/lo as alcohol.
victimofmaths.bsky.social
In statistical analyses, controlling for age, sex, socioeconomic position, alcohol consumption etc. we found that only conformity was significantly associated with no/lo consumption.

This means that people who say that they drink alcohol to fit in are more likely to drink no/lo drinks.
victimofmaths.bsky.social
In the overall population, drinking for enhancement or social reasons was much more common than for conformity, coping with anxiety or coping with depression.

But among no/lo drinkers the spread was much more even.