Jennifer Withrow
@withrowjenny.bsky.social
1.3K followers 610 following 5 posts
she/her. Economic Historian. Views are my own. PhD UMass Amherst. https://sites.google.com/view/jennifer-withrow 📍Philly
Posts Media Videos Starter Packs
Reposted by Jennifer Withrow
kaseybuckles.bsky.social
Census Tree birthday party Day 9 🎂🎉:

@withrowjenny.bsky.social uses the Census Tree to explore the roles of race & gender in migrant selection & sorting during the exodus of single young people from U.S. Southern farms from 1900-1940. Female migration rates ⬆️ in response to ⬇️ male marriageability.
withrowjenny.bsky.social
Congratulations Meredith!
Reposted by Jennifer Withrow
erikamcentarfer.bsky.social
It has been the honor of my life to serve as Commissioner of BLS alongside the many dedicated civil servants tasked with measuring a vast and dynamic economy. It is vital and important work and I thank them for their service to this nation.
Reposted by Jennifer Withrow
daniellecgw.bsky.social
This has happened before: as late as 1982, Goldsboro Christian School in North Carolina did not admit Black students because “We believe that God in his plan and purpose and wisdom separated men into . . . races and that those races should be preserved” (source: www.nytimes.com/1982/01/18/u...)
Reposted by Jennifer Withrow
kundong.bsky.social
#CNS2025 Symposium Session 9 | Happening now
Hosted by Aaron Kucyi kicking-off immerging cool research area in “Decoding spontaneous thought from neural activity.”
Reposted by Jennifer Withrow
kundong.bsky.social
#CNS2025 | Happening now
Symposium 9 Talk 2
Prof. Aaron Kucyi is sharing the preliminary results under the topic of “predicive neural modeling of resting-state spontaneous though” with neural data from 3 intensively-sampled individuals.
Reposted by Jennifer Withrow
arielron.bsky.social
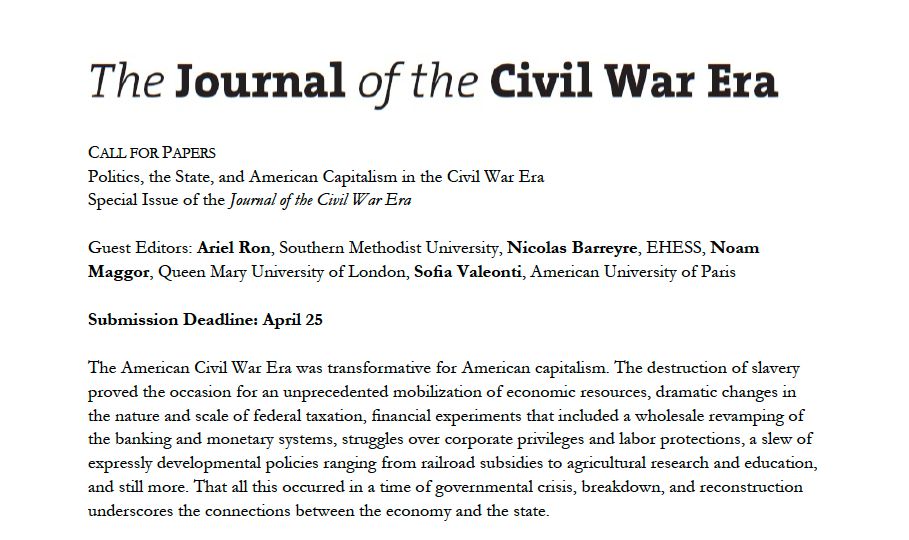
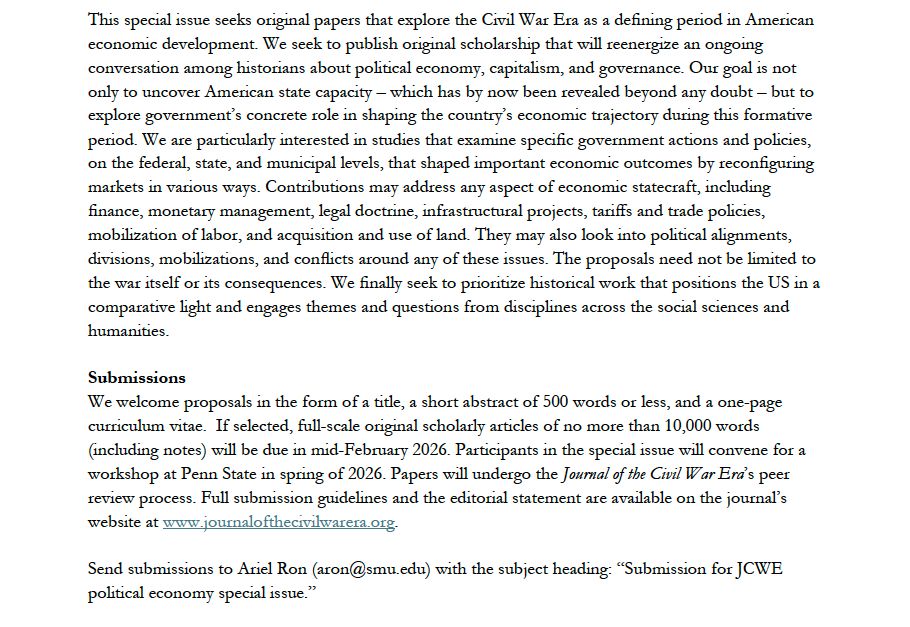
The Journal of the Civil War Era will have a special issue on political economy edited by me, @maggor.bsky.social, Sofia Valeonti & Nicolas Barreyre. I'll post again when the link is up on the Muster, but wanted to get the word out now. See CFP. Submission deadline is April 25. 🗃️
Reposted by Jennifer Withrow
bitsyperlman.bsky.social
I'm very sad that "I have a paper on this" continues

Funding delays of > 30 days lead to, after 5 years:

- 40% increase in scientists exiting US labor force (effect concentrated among those born in the US)
- 20% decrease in wages
- Burden is born by postdocs, grad students, and staff
Reposted by Jennifer Withrow
bitsyperlman.bsky.social
It's such a weird thing to hear the news and think "that's bad, but also I have a paper about (an aspect) of that"

Funding delays are really not great for people who work in science. Funding delays of > 30 days lead to:

- 40% increase in scientists exiting US labor force
- 20% decrease in wages
withrowjenny.bsky.social
We extended the Environmental Impacts Frame backward to 1940 using the Census Bureau's historical decennial and IRS 1040 data! Looking forward to working with and seeing what others do with these cool new (old) data!
dismalscientist86.bsky.social
📈📉 New Census Working Paper: "The Census Historical Environmental Impacts Frame" by Jenny Withrow (@withrowjenny.bsky.social), Kendall Houghton, Eva Lyubich, Mary Munro, Suvy Qin, and John Voorheis (@johnvoorheis.bsky.social) www.census.gov/library/work...
The Census Bureau’s Environmental Impacts Frame (EIF) is a microdata infrastructure that combines individual-level information on residence, demographics, and economic characteristics with environmental amenities and hazards from 1999 through the present day. To better understand the long-run consequences and intergenerational effects of exposure to a changing environment, we expand the EIF by extending it backward to 1940. The Historical Environmental Impacts Frame (HEIF) combines the Census Bureau’s historical administrative data, publicly available 1940 address information from the 1940 Decennial Census, and historical environmental data. This paper discusses the creation of the HEIF as well as the unique challenges that arise with using the Census Bureau’s historical administrative data. Line chart titled "Figure 2: Share of HEIF Individuals in Spine, by Year and Age." The x-axis represents age (ranging from 0 to 80), and the y-axis represents the share of individuals (ranging from 0 to 0.6). Four lines show trends for males and females in 1970, 1975, and 1995. The shares increase sharply in early adulthood, stabilize during midlife, and decrease gradually from around age 60, with some differences by gender and year.
Reposted by Jennifer Withrow
mattanelson.bsky.social
Some current issues to update 1950 Preliminary IPUMS Full Count Data users;

1. Educational attainment is underestimated.
2. RACE data underrepresent Japanese and Chinese persons in the population.
usa.ipums.org
withrowjenny.bsky.social
🙋‍♀️ (thank you!)
withrowjenny.bsky.social
Please add me! Thank you!