World Happiness Report
@worldhappiness.report
100 followers 3 following 78 posts
The world’s foremost publication on global happiness: a partnership of Gallup, the Wellbeing Research Centre, and UN Sustainable Development Solutions Network.
Posts Media Videos Starter Packs
Pinned
worldhappiness.report
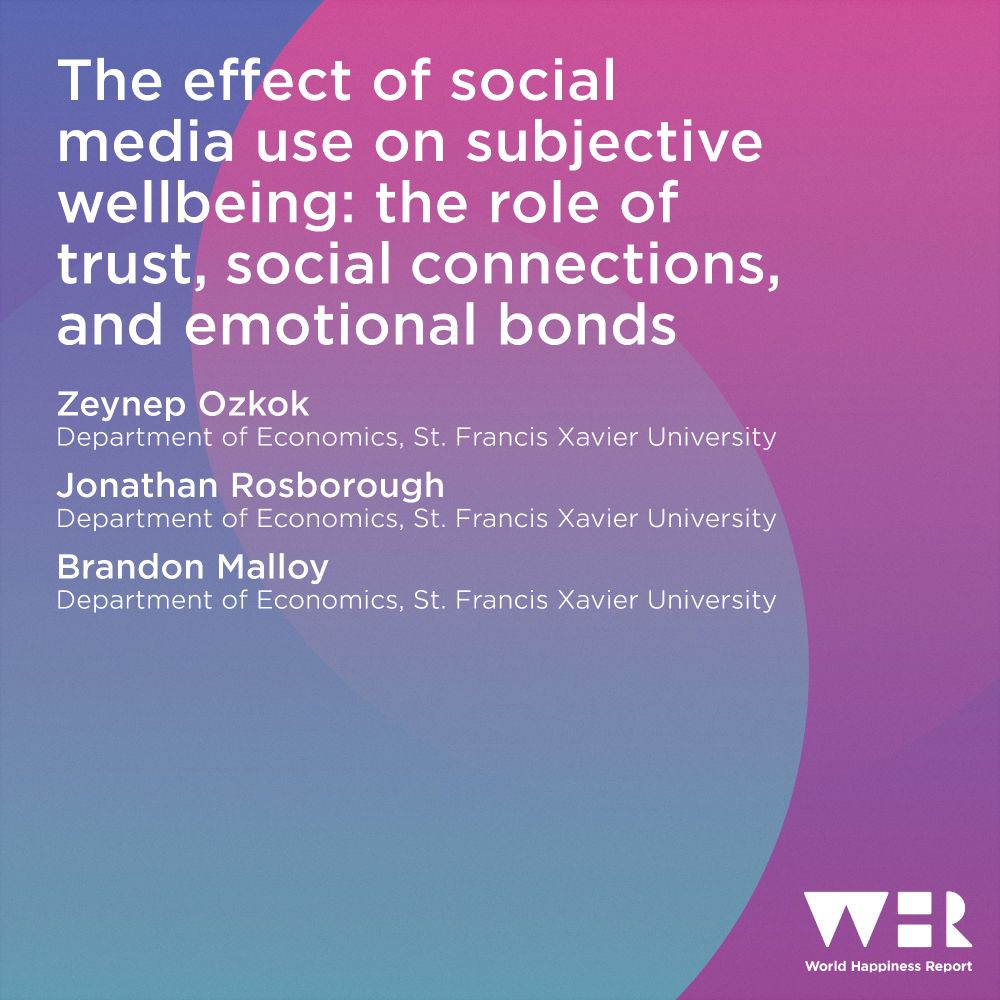
NEW: We’ve assembled a global team of leading researchers to examine the association between social media and #wellbeing for World Happiness Report 2026.👇
Our 2026 Author Team, World Happiness Report 2026: Social Media and Wellbeing
worldhappiness.report
It’s Do Something Nice Day.

And these three acts of kindness don’t only help others, they can also improve your own life satisfaction.

Which one can you do today?

Explore the relationship between happiness and prosocial behaviour 👉 www.worldhappiness.report/ed/2019/happ...
Graphic with the title “Three Ways to do something nice today”. A call to action encourages users to swipe to explore. Graphic presenting a numbered list:
1 Volunteer your time
2 Donate money
3 Help a Stranger 

The source is Chapter 4 of the 2019 World Happiness Report, ‘Happiness and Prosocial Behavior: An Evaluation of the Evidence’, for which a full citation is provided.
worldhappiness.report
In 2024, the countries topping the smile leaderboard were:

🇮🇩 Indonesia
🇸🇳 Senegal
🇴🇲 Oman
🇵🇦 Panama
🇱🇦 Lao PDR
worldhappiness.report
What is happiness?

Many think of it as a positive emotional state: smiling and feeling good (positive affect). It is often used to describe assessments and judgements too (life satisfaction).

Interestingly, the countries most satisfied with life are not smiling the most. 👇

#WorldSmileDay
Horizontal range plot presented under the title “Difference in Life Satisfaction and Smiling Frequency, 2024”.

The subtitle reads “The five countries that top the life satisfaction ranks are not the countries that are smiling the most”.

The difference in life satisfaction rank and smiling rank are presented for five countries that self-reported the highest life satisfaction in 2024. 

Finland ranks first in life satisfaction and 67th in terms of smiling frequency. Denmark is second in life satisfaction, 38th in smiles. Iceland scores 3rd in life satisfaction, 14th in smiles. Sweden was fourth in life satisfaction and ranked 53rd in smiles. Israel came fifth for life satisfaction, 131st for smiling frequency. 

The source of the graph is the Gallup World Poll and the World Happiness Report.
worldhappiness.report
🗣️ “...I suggest we go further and reclaim the idiom ‘misery loves company’. If these findings tell us anything, it’s that *happiness* loves company.”

Read more 👉 mailchi.mp/worldhappine...
Subscribe 👉 worldhappiness.report/subscribe/
Two friends sat next to one another in a coffee shop. One friend smiles as she looks at the other. Headline reads “Happiness loves company”. A sub-heading reads “Curated content from the World Happiness Report”, plus a date label for September 2025.
worldhappiness.report
⛓️💥 Social relationships provide one of the most reliable paths to happiness, but sometimes life gets in the way.

Yet, people are surprisingly hesitant to reconnect – by better understanding why, we can learn how to encourage people to reach out.👇
doi.org/10.1038/s442...
Box plots presented under the title “The Challenge of Reconnection”. Subtitle reads: “People prefer to hear from an old friend than to reach out themselves, suggesting initiating contact may be a primary barrier to reconnecting.”

Two pairs of box plots present the median, mean, and distribution of the level of interest in hearing from an old friend (pink) versus reaching out to the same friend themselves (purple). The first pair of box plots presents the level of interest for both modes at the present time. Respondents are much less interested in reaching out to an old friend than in hearing from them. The second pair presents the same two modes, but considering the future – respondents are now more interested in reaching out, but still not as interested as in hearing from a friend.

The source of the chart is the article “People are surprisingly hesitant to reach out to old friends”, published in the journal Communications Psychology, of which a full citation is provided.
worldhappiness.report
Deaths of despair are preventable deaths due to suicide, alcohol abuse, and drug overdose.

Encouragingly, increases in prosocial behaviours are reliably connected to decreasing deaths of despair around the world.

Read more in Ch6 of #WHR2025👇
doi.org/10.18724/whr...
Horizontal stacked bar chart presented under the title “Annual Change in Deaths of Despair, 2000-2019”.

The average annual change in deaths of despair for 59 countries is presented, grouped by global region. Countries with the greatest reduction in deaths of despair during this time include Lithuania, Latvia, and Estonia. Countries with the greatest increase in deaths of despair during this time include the United States, Republic of Korea, and Slovakia.

The source of the graph is the World Health Organization, presented in Figure 6.2 from World Happiness Report 2025, published in the chapter “Supporting others: How prosocial behaviour reduces deaths of despair”, of which a full citation is provided.
worldhappiness.report
Access full research details in Ch8 of #WHR2025 👉 www.worldhappiness.report/ed/2025/givi...
2 Taimaka

Taimaka is an impact-minded organisation which treats acute malnutrition in northeastern Nigera through a method called community management of acute malnutrition (CMAM). 

$15.15 per WELLBY 1 Pure Earth

Pure Earth prevents exposure to toxic pollutants and protects public health in low- and middle-income countries through global and local collaboration.

$9.23 per WELLBY Read the full report at worldhappiness.report
worldhappiness.report
Your money can buy happiness for others.

But the cost-effectiveness of donations, measured by wellbeing-years (WELLBYs), varies dramatically between charities.

Discover the five charities that have the lowest cost per WELLBY, according to @happierlives.bsky.social research in #WHR2025.
Giving to others. Convert your money into greater happiness for others. Swipe to find out how…
worldhappiness.report
🫠 We know that reaching out to an old friend will make us happy, so why does it feel so difficult?

Listen to Lara Aknin discuss the social psychology behind our hesitance to reconnect on this episode of Behind the Data👇
shows.acast.com/behind-the-d...
Image of Prof Lara B. Aknin, Editor of the World Happiness Report, alongside the quote: “Social connection […] might be one of the clearest paths to happiness, but sometimes we get in our own way.”
worldhappiness.report
🎒 What makes for a happy adolescence? The exact factors vary for every individual, but analysis of data collected from over 90,000 15-year-olds across 13 OECD countries reveals some persistent indicators correlated with satisfaction with life.

Read more in Ch3 of #WHR2024👇
doi.org/10.18724/whr...
Horizontal bar chart presented under the title “Indicators of Life Satisfaction at 15”. Subtitle reads: “Factors like satisfaction with body image and relationships with parents are most closely associated with life satisfaction at age 15.”

A total of 10 factors are listed, listed by their correlation with life satisfaction. The largest correlative effects are observed for satisfaction with ‘the way you look’ and ‘the relationship with your parents/guardians’.

The source of the graph is PISA (2022), presented in Table 3.4 from World Happiness Report 2024, published in the chapter “Child and Adolescent Well-being: Global Trends, Challenges and Opportunities”, of which a full citation is provided.
worldhappiness.report
NEW: We’ve assembled a global team of leading researchers to examine the association between social media and #wellbeing for World Happiness Report 2026.👇
Our 2026 Author Team, World Happiness Report 2026: Social Media and Wellbeing
worldhappiness.report
💰 Does money make us happier? While richer countries generally exhibit higher average levels of #wellbeing, this correlation is significantly influenced by social variables – like healthy life expectancy and social support.

Read more, via ‪@cep-lse.bsky.social‬ 👉 blogs.lse.ac.uk/inequalities...
Scatter plot presented under the title “Life Evaluation and GDP (per capita)”. Subtitle reads: “As income rises, its link with happiness weakens - in the richest countries, social factors have a more significant impact on average life evaluation.”

GDP per capita (in thousands) is plotted on the x-axis against life evaluation on the y-axis. A line indicating the predicted life evaluation (no controls) rises steeply at lower income levels, levelling off as income rises. Points represent the actual reported population-level average life evaluation for 157 countries, which are clustered close to the predicted line at lower income levels but become far more scattered at higher income levels.

The source of the chart is the Gallup World Poll (2009-2019), published in the discussion paper “The Easterlin Paradox at 50”, of which a full citation is provided.
worldhappiness.report
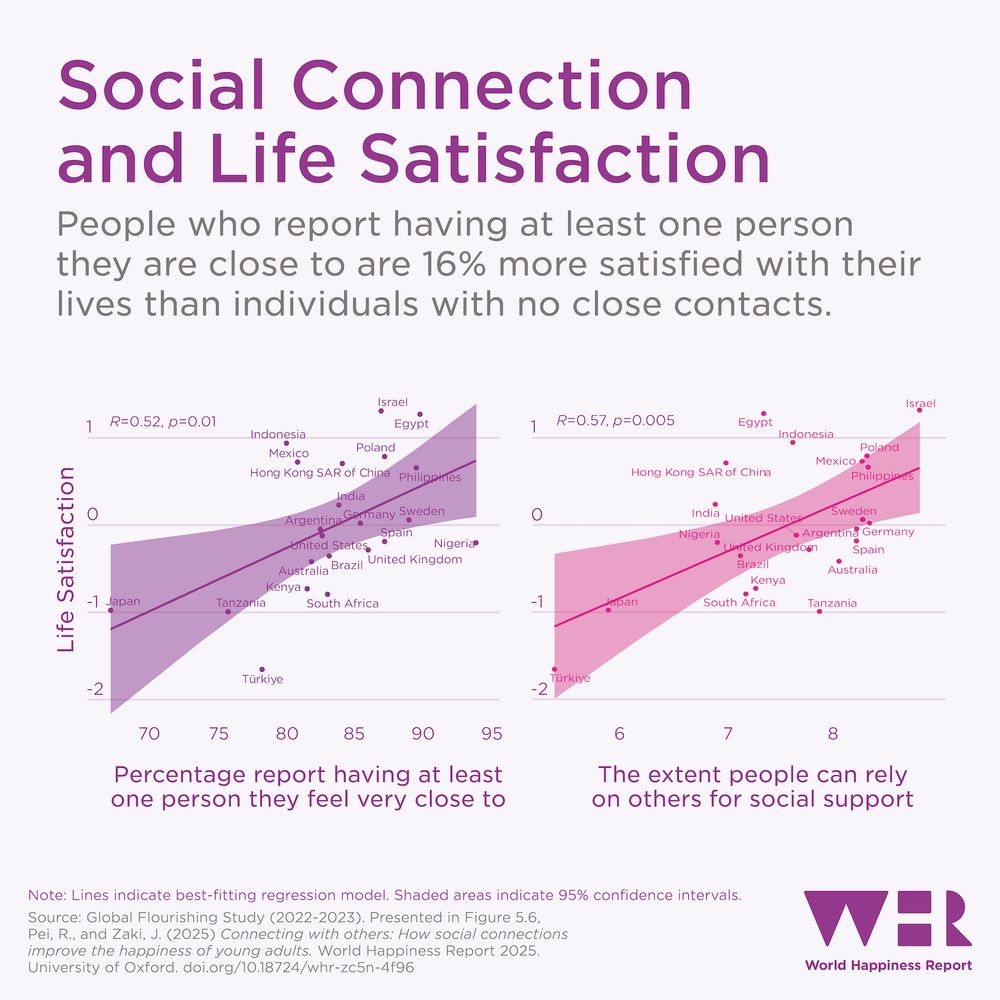
💜💖 When it comes to social connections, both *quantity* and *quality* are important for our #wellbeing.

Read more in Ch5 of #WHR2025👇
doi.org/10.18724/whr...
Two scatter plots presented under the title “Social Connection and Life Satisfaction”. Subtitle reads: “People who report having at least one person they are close to are 16% more satisfied with their lives than individuals with no close contacts.”

The left chart plots 22 countries’ average life satisfaction against the percentage of people who report having at least one person they feel very close to, while the right chart plots against the extent to which people can rely on others for social support.

Trendlines and shaded 95% confidence intervals are provided for both charts, presenting strong positive correlation for both factors.

The source of the charts is the Global Flourishing Study (2022-2023), presented in Figure 5.6 from World Happiness Report 2025, published in the chapter “Connecting with others: How social connections improve the happiness of young adults”, of which a full citation is provided.
worldhappiness.report
Since most of us spend around a third of our lives at work, isn’t it about time we started taking workplace #wellbeing seriously?

Read more 👉 mailchi.mp/worldhappine...
Subscribe 👉 worldhappiness.report/subscribe/
A man in a business suit using headphones to make a phone call. Headline reads “Nine to thrive”. A sub-heading reads “Curated content from the World Happiness Report”, plus a date label for July 2025.
worldhappiness.report
3️⃣ Caring for, and sharing with, other people feels good. And we can amplify the #wellbeing benefit of caring and sharing in the context of three Cs: caring connections, choice, and clear positive impact.

Read more in Ch2 of #WHR2025👇
doi.org/10.18724/whr...
Graphic presenting the three Cs of amplifying wellbeing through caring and sharing.

Caring connections enhance wellbeing for both givers and recipients.

People are more likely to feel happy about giving when they have a choice in how they help.

Seeing a clear positive impact of our actions increases motivation and joy.

The source of the information is the chapter “Caring and sharing: Global analysis of happiness and kindness” of World Happiness Report 2025, of which a full citation is provided.
worldhappiness.report
🥰 Social media is an invaluable source of data for #wellbeing research: researchers can study emotional experiences by analysing publicly-available posts (emojis and all!).

Read more in Ch4 of #WHR2022👇
www.worldhappiness.report/ed/2022/usin... | #WorldEmojiDay
Selection of emoji on a phone screen.
worldhappiness.report
↔️ Of the 19 countries that have gained a point or more on the 0–10 scale of life evaluation since 2010-2012, 12 are in Central and Eastern Europe, reflecting the European happiness convergence that has been clear for more than a decade.
Horizontal bar chart presented under the title “Biggest Changes in Life Evaluation, 2010-2024”. Subtitle reads: “Average life evaluation in Serbia has improved more than anywhere else in the past decade and a half - by almost two whole points.”

Bars representing the positive change in life evaluation for Serbia, Bulgaria, Georgia are presented, alongside bars representing the negative change for Jordan, Lebanon and Afghanistan. Data is provided for each country’s performance in 2010-2012, versus 2022-2024.

Different colours within each bar represent how much of each country’s score can be explained by: GDP per capita; social support; healthy life expectancy; freedom to make life choices; generosity; and perceptions of corruption. The remainder is explained by dystopia, plus a residual value.

The source of the graph is the Gallup World Poll, published in the chapter “Caring and sharing: Global analysis of happiness and kindness”, of which a full citation is provided.
worldhappiness.report
🇮🇳 Average life evaluation in India has never passed 5 (out of 10), though it has been steadily climbing since 2020.

#WorldPopulationDay
Line graph presented under the title “Life Evaluation in India, 2012-2024”. Subtitle reads: “The world's most populous country, India is home to 1.46 billion people - that's almost 18% of the world's total population.”

The average life evaluation in India is plotted on a 0-10 scale for the years 2012 to 2025. Starting just below 5, life evaluation falls year on year to a low in 2020 at around 3.5, before steadily rising to around 4.5 in 2025.

The source of the graph is the Gallup World Poll, published in the chapter “Caring and sharing: Global analysis of happiness and kindness” in World Happiness Report 2025, of which a full citation is provided.
worldhappiness.report
🧒 Childhood and adolescence are important stages of life in their own right – but they are also hugely consequential for our future #wellbeing.👇
Horizontal bar chart presented under the title “Predictive Power of Childhood Outcomes”. Subtitle reads: “Emotional health and subjective wellbeing during childhood are a better predictor of adult life satisfaction than academic performance.”

Three measures are presented: highest qualification; behaviour at 16; and emotional health at 16. Emotional health at 16 is shown to have a greater predictive power than highest qualification, and both are much higher than behaviour at 16.

The source of the graph is the book “The Origins of Happiness: The Science of Well-Being over the Life Course”, published by Princeton University Press, of which a full citation is provided.
worldhappiness.report
🟣⚪️⚪️⚪️ In 2023, roughly 1 in 4 Americans reported eating all of their meals alone the previous day – an increase of 53% since 2003.

Read more in Ch3 of #WHR2025👇
doi.org/10.18724/whr...
Scatter plot  presented under the title “Dining Alone in the United States, 2003-2023”. Subtitle reads: “In 2023, roughly 1 in 4 Americans reported eating all of their meals alone the previous day - an increase of 53% since 2003.”

The chart plots the percentage of people eating all meals alone in the previous day, from 2003 to 2023. 95% confidence intervals are displayed for each point.

There is a clear upward trend for the time period presented, from just above 17% in 2003 to more than 26% in 2023, with a particularly large jump between 2018 and 2019.

The source of the graph is the American Time Use Survey, presented in Figure 3.11 from World Happiness Report 2025, published in the chapter “Sharing meals with others: How sharing meals supports happiness and social connections”, of which a full citation is provided.
worldhappiness.report
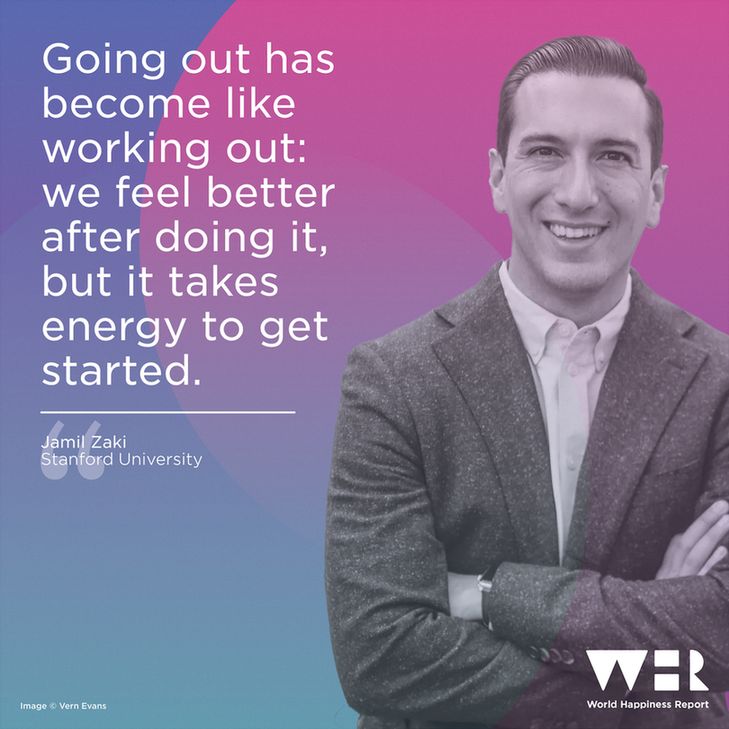
💪 Social connection is vital for our #wellbeing, and especially that of young adults: connecting with others buffers from the toxic effects of stress and significantly enhances subjective wellbeing during young adulthood.

Read more in Ch5 of #WHR2025👇
doi.org/10.18724/whr...
Image of Jamil Zaki of Stanford University, alongside the quote: “Going out has become like working out: we feel better after doing it, but it takes energy to get started.”