Zack Labe
@zacklabe.com
41K followers 1K following 3.7K posts
Climate Scientist at @climatecentral.org | PhD | Passionate about improving science communication through data-driven stories | Harrisburg, PA | https://zacklabe.com/ Views, thoughts, and opinions expressed here are only my own.
Posts Media Videos Starter Packs
Pinned
zacklabe.com
🧵 Looking for (polar) climate data visualizations? Start here! 📈📉🧪⚒️🌊

+ Polar climate change: zacklabe.com/arctic-sea-i...
+ Global climate change indicators: zacklabe.com/climate-chan...
+ #Arctic sea ice extent: zacklabe.com/arctic-sea-i...
+ #Antarctic sea ice: zacklabe.com/antarctic-se...
zacklabe.com
Last month observed above average temperatures across large portions of both the #Greenland and #Antarctic Ice Sheets. Anywhere in dark red shading is more than 5°C warmer than the 1981-2010 climatological average.

Data available from doi.org/10.24381/cds...
Map of Greenland showing 2-m air temperature anomalies in September 2025. Red shading is shown for warmer than average temperatures, and blue shading is shown colder than average temperatures. Anomalies are calculated relative to 1981-2010. Polar stereographic map of 2-m air temperature anomalies in the Antarctic for September 2025. Red shading is shown for warmer anomalies, and blue shading is shown for colder anomalies. There is a sharp gradient in temperature anomalies across the region. Anomalies are calculated relative to a 1981-2010 baseline.
zacklabe.com
The Relative Oceanic Niño Index (RONI) continues to show our gradual shift to more La Niña-like conditions in the equatorial Pacific Ocean. Seasonal forecast models still highlight a La Niña emerging through this coming boreal winter

Graphic updated in near-real time at zacklabe.com/climate-chan...
Time series of the relative oceanic nino index (RONI) from 1950 to 2025. Labels are shown for El Nino or La Nina conditions. There is significant variability over time.
zacklabe.com
This worked now - thank you!
zacklabe.com
Thank you - it's been great! :)
zacklabe.com
Hmmmm, unfortunately this image isn't showing up for me.
zacklabe.com
I show volume conditions on my website: zacklabe.com/arctic-sea-i..., which are unusually low right now (record low average ice thickness).

However, like ice extent, there has been no short-term declining trend in the annual minimum of sea ice volume since ~2012 either.
Arctic: Sea-Ice Thickness/Volume
Near real-time visualizations [Arctic Climate Seasonality and Variability] [Arctic Sea-Ice Extent and Concentration] [Arctic Sea-Ice Volume and Thickness] [Arctic Temperatures] [Antarctic Sea-Ice E…
zacklabe.com
zacklabe.com
These warmer conditions on the Atlantic side of the Arctic have been offset by the very rapid freeze-up on the Pacific side. A lot of the previously low concentration ice in the Chukchi and Beaufort Seas was able to quickly refreeze, which boosts the extent numbers.
zacklabe.com
They use different models to create their own reanalysis datasets. A lot of the sea ice community (including myself) has spent time validating PIOMAS in particular, which does a pretty good job relative to satellite-derived data. Here is some more information on the product...
Pan-Arctic Ice Ocean Modeling and Assimilation System (PIOMAS) | Climate Data GuidePan-Arctic Ice Ocean Modeling and Assimilation System (PIOMAS) | Climate Data Guide
climatedataguide.ucar.edu
zacklabe.com
Much of the #Arctic Circle observed warmer than average conditions in September 2025. Some of the largest anomalies were over Greenland and northern Canada, though regionally-dependent anomalies were over Siberia.

High resolution version updated monthly for download at zacklabe.com/arctic-tempe...
Two polar stereographic maps side-by-side showing actual air temperatures in September 2025 on the left and the temperature anomaly on the right for September 2025. Anomalies are calculated relative to a 1981-2010 baseline. All data uses ERA5 reanalysis. Most areas are warmer than average.
zacklabe.com
October has observed some of the largest warming trends in the #Arctic. This is greatest over areas with a lack of sea ice cover (nearly all of the Siberian Arctic). Arctic amplification is largest in the boreal fall.

Data: doi.org/10.24381/cds.... Info: doi.org/10.1175/BAMS....
Polar stereographic map of 2-m temperature trends in units of °C per decade over the Arctic for the month of October. Trends are calculated over the 1979 to 2024 period using ERA5. The largest warming is an areas of open water that were previously sea ice covered along the Siberian side of the Arctic. These trends exceed 2°C/decade in these areas.
zacklabe.com
Thank you! I’m so glad to hear that they are useful ☺️
zacklabe.com
Monday ice update - #Arctic sea ice extent is currently the 14th lowest on record (JAXA data) 🧪

• about 310,000 km² above the 2010s mean
• about 950,000 km² below the 2000s mean
• about 2,070,000 km² below the 1990s mean
• about 2,720,000 km² below the 1980s mean

More: zacklabe.com/arctic-sea-i...
Line graph time series of 2025's daily Arctic sea ice extent compared to decadal averages from the 1980s to the 2010s. The decadal averages are shown with different colored lines with purple for the 1980s, blue for the 1990s, green for the 2000s, and white for the 2010s. Thin white lines are also shown for each year from 2000 to 2024. 2025 is shown with a thick gold line. There is a long-term decreasing trend in ice extent for every day of the year shown on this graph between August and November by looking at the decadal average line positions.
zacklabe.com
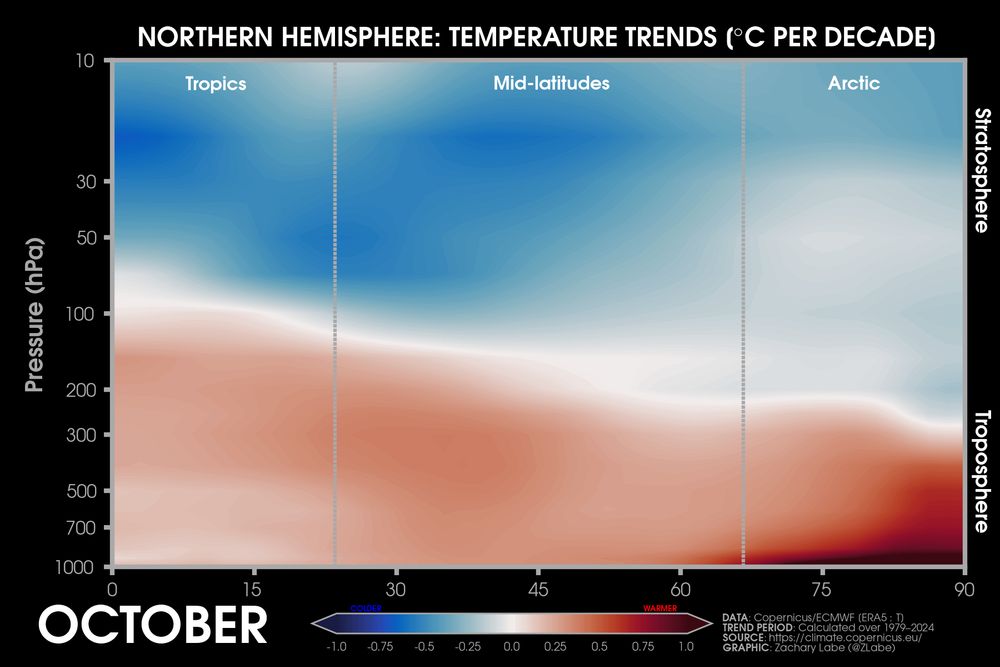
Warming prominently extends vertically aloft into the lower/mid-troposphere over the #Arctic region in October (i.e., notable Arctic amplification temperature trends).

Data from @copernicusecmwf.bsky.social ERA5 reanalysis; possible influences of this warming: doi.org/10.1029/2020...
Vertical cross section (latitude vs. pressure) plot showing zonal mean temperature trends for the Northern Hemisphere in Octobers from 1979 to 2024. The Arctic is warming the fastest. The troposphere is warming in all regions and the stratosphere is cooling overtop all regions.
zacklabe.com
The dataset they use for an "atmosphere" in the model ends in 2010 (climatedataguide.ucar.edu/climate-data...) Hopefully, there is funding in the future for iterations of this volume data that extend forward.
zacklabe.com
Simulated reconstruction of October #Arctic sea ice thickness since 1901. Interannual variability and an obvious decrease in recent years.

Information about this data set is available at doi.org/10.1175/JCLI.... Note that it is only updated through 2010 due to ERA-20C forcing.
zacklabe.com
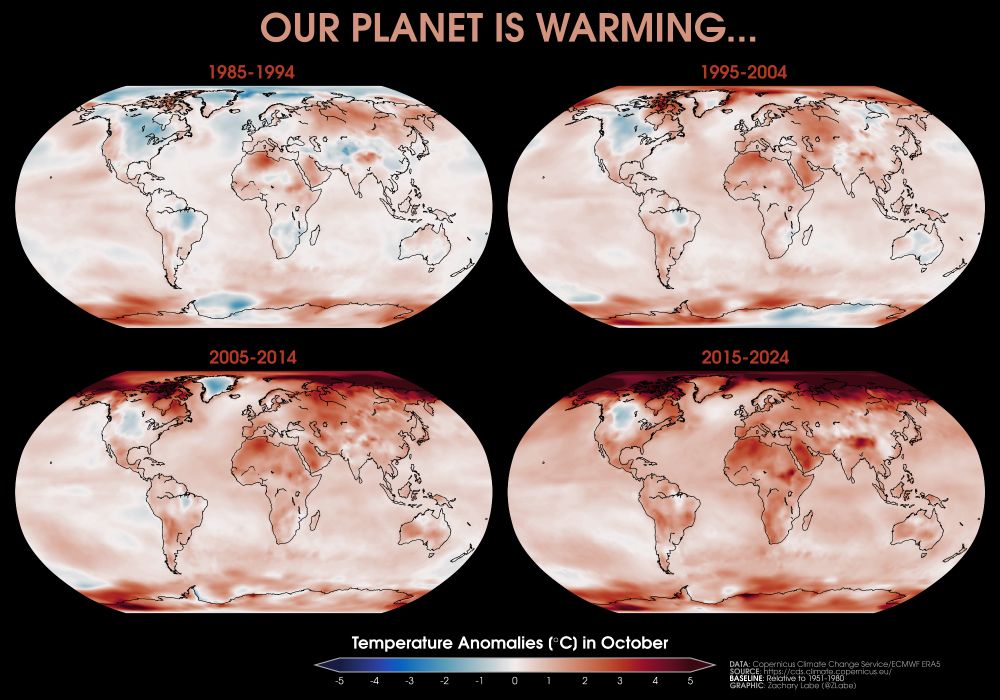
Happy October! 🍂 Like other times of year, our planet is heating up this month… but some regions warm faster than others. Arctic amplification especially ramps up in October.

Maps show the changes in October temperature over the last 4 decades. Data used from @copernicusecmwf.bsky.social ERA5.
Four global maps showing near-surface air temperature anomalies for the month of October in 1985-1994, 1995-2004, 2005-2014, and 2015-2024. Most all areas are observing long-term warming, which is largest over the Arctic region and Asia. Anomalies are calculated relative to 1951-1980 from ECMWF ERA5 reanalysis.
zacklabe.com
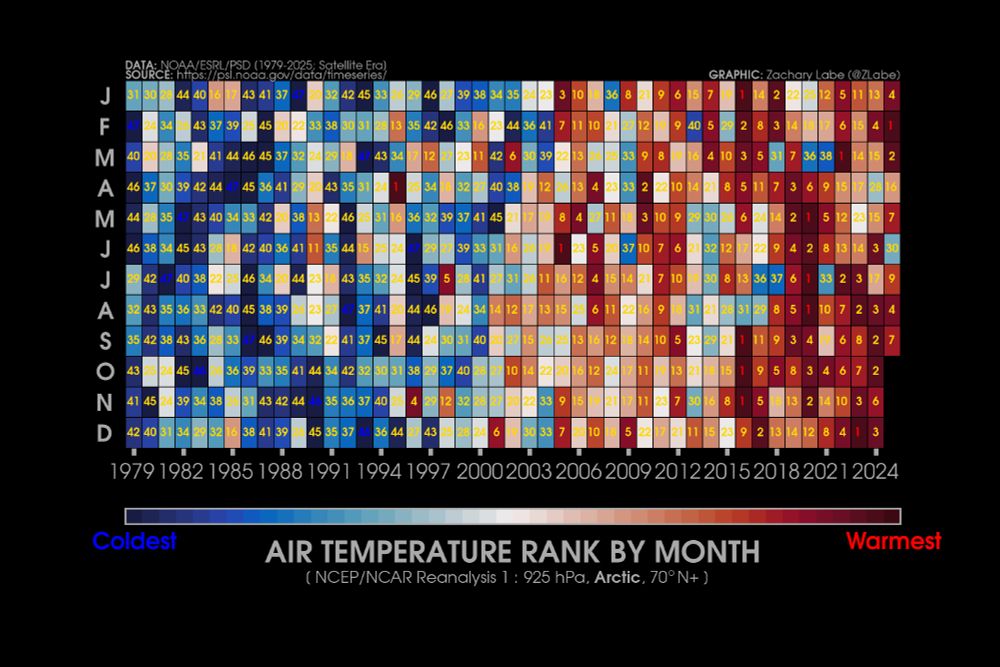
#Arctic air temperature rank by month over the satellite era - now updated through September 2025...

+ Ranks: 1=warmest (red), 46/47=coldest (blue)
+ Download higher resolution version: zacklabe.com/arctic-tempe...
Heat map-style graphic showing monthly air temperature rankings in the Arctic at the 925 hPa level for each month from January 1979 to September 2025. There is a long-term warming trend evident in each month. Blue shading is shown for colder months, and red shading is shown for warmer months. A yellow number is shown for each grid box to display the actual temperature ranking. September 2025 was the 7th warmest September on record.
zacklabe.com
Record warm ocean temperatures continued in September across the North Pacific Ocean, with a number of consequential impacts (including on downstream weather patterns).

This graph shows the average for a band across the midlatitudes for every September from 1854-2025 using @noaa.gov ERSSTv5 data.
Green line graph time series of average sea surface temperature anomalies for each September from 1850 through 2025 for only the midlatitude region of the North Pacific Ocean. There is large interannual variability, but an overall long-term increasing trend. Anomalies are computed relative to a 1981-2010 baseline. 2025 is a record high.
zacklabe.com
Thank you for sharing it!
zacklabe.com
Which I have been posting repeatedly about on my website: bsky.app/profile/zack...
zacklabe.com
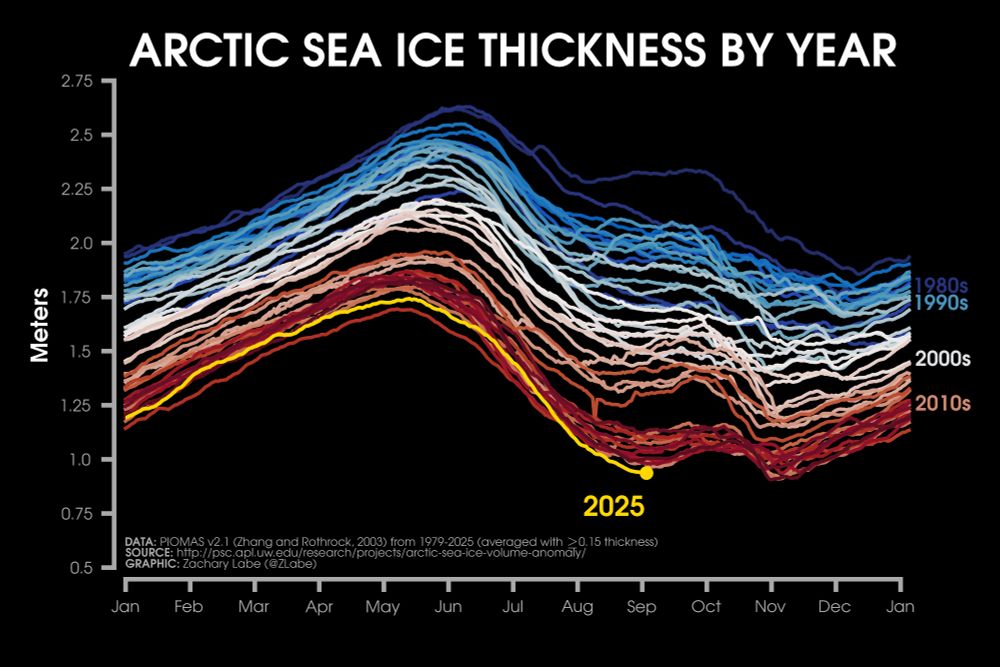
⚠️ While extent will not be setting any annual minimum records this year, the average thickness of #Arctic sea ice is actually at historic lows for this time of year (in the dataset by PIOMAS). Thinner ice is younger and usually more fragile.

More graphics of volume: zacklabe.com/arctic-sea-i...
Line graph time series of daily mean Arctic sea ice thickness for each year from 1979 to 2025 using shades of red, white and blue. A seasonal cycle is shown with thicker ice in late winter and thinner ice in late summer. A long-term decreasing trend is also visible. Data is from PIOMAS v2.1.
zacklabe.com
Last month was the 3rd lowest #Antarctic sea ice extent on record for the month of September.

This was 850,000 km² below the 1981-2010 September average. Data from the @nsidc.bsky.social: nsidc.org/data/seaice_...
zacklabe.com
The extent of #Antarctic sea ice is currently the third smallest on record for this time of year. This is about 1 million square kilometers below the 1981-2010 climatological average extent.

More graphics at zacklabe.com/antarctic-se...
Line graph time series of 2025's daily Antarctic sea ice extent anomalies in red shading compared to each year from 1979 to 2024 using shades of purple to white for each line, but only for the days between September and November. Anomalies are computed relative to a 1981-2010 baseline. There is substantial interannual and daily variability. There are no clear long-term trends.
zacklabe.com
It's always something anymore 🥹