

Reposted by: Alex Singleton

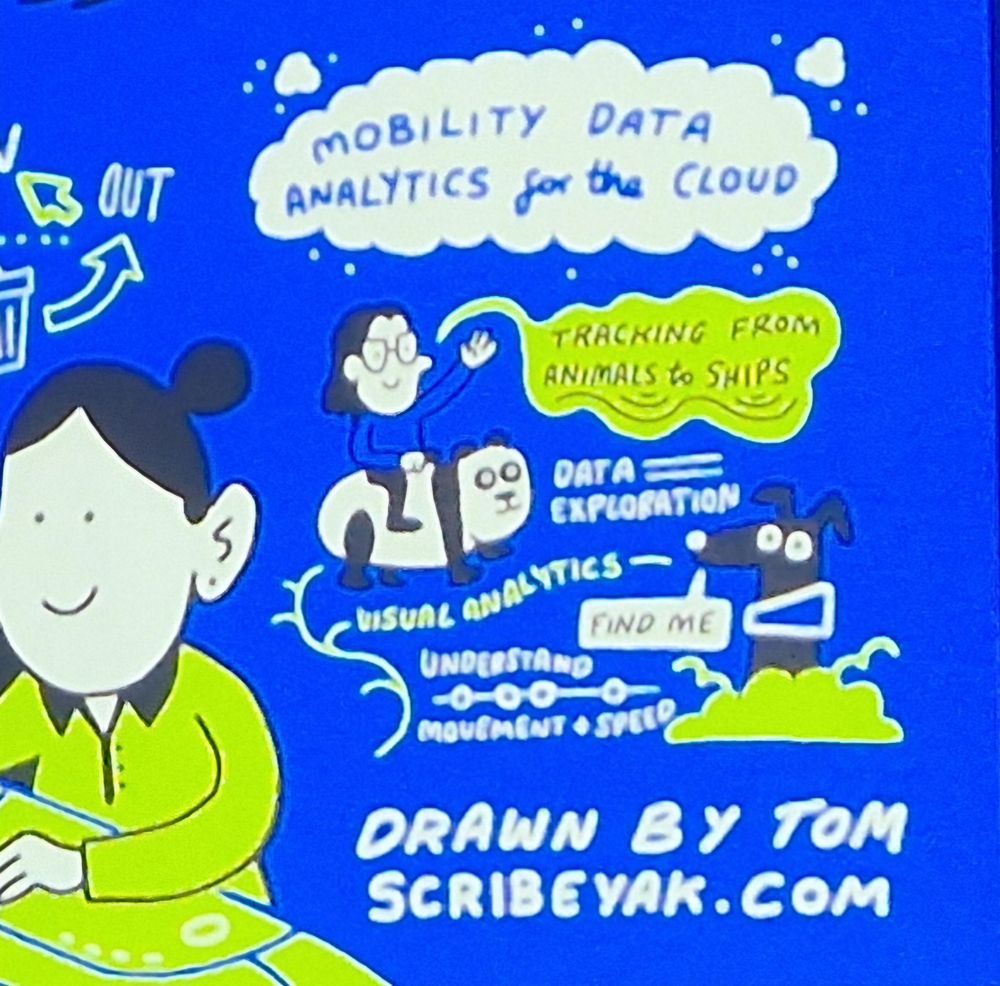
No pandas were harmed in the process 😉
@movingpandas #movementdataanalysis

by Alex Singleton — Reposted by: Alex Singleton
Reposted by: Alex Singleton

New blog post with download links for Council Tax lists from Birmingham City Council and Lichfield District Council, including full addresses, CT bands, and UPRNs.
#FOI #openaddresses #opendata
Reposted by: Alex Singleton
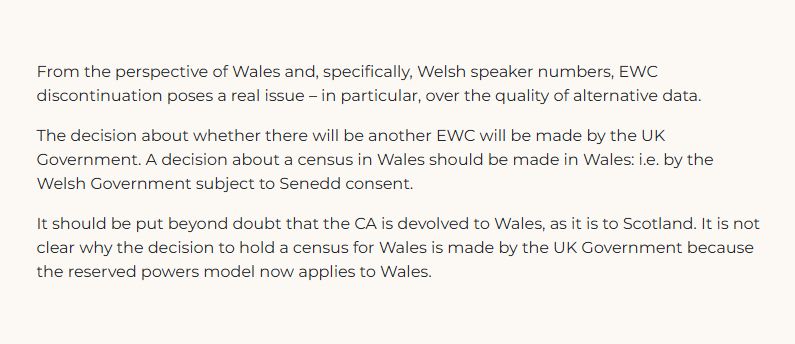
Argument from Dr Huw Evans that, if the UK Government discontinues the decennial Census for England and Wales, the Welsh Government should be able to mandate a Census for Wales alone.
#Census2031 #opendata #devolution
by Alex Singleton — Reposted by: Andrew Hudson‐Smith
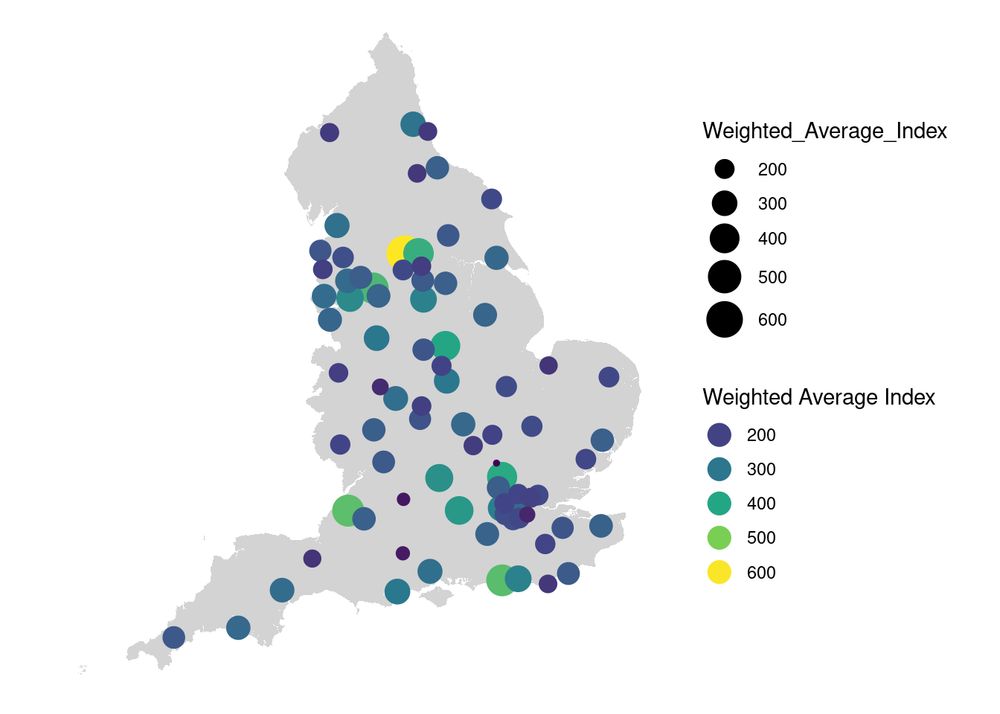
Todays map is an exploration of small area Gross Value Added (GVA) data in England and was an excuse to look at these in the context of retail centres. All #rstats code provided, but a bit rough!
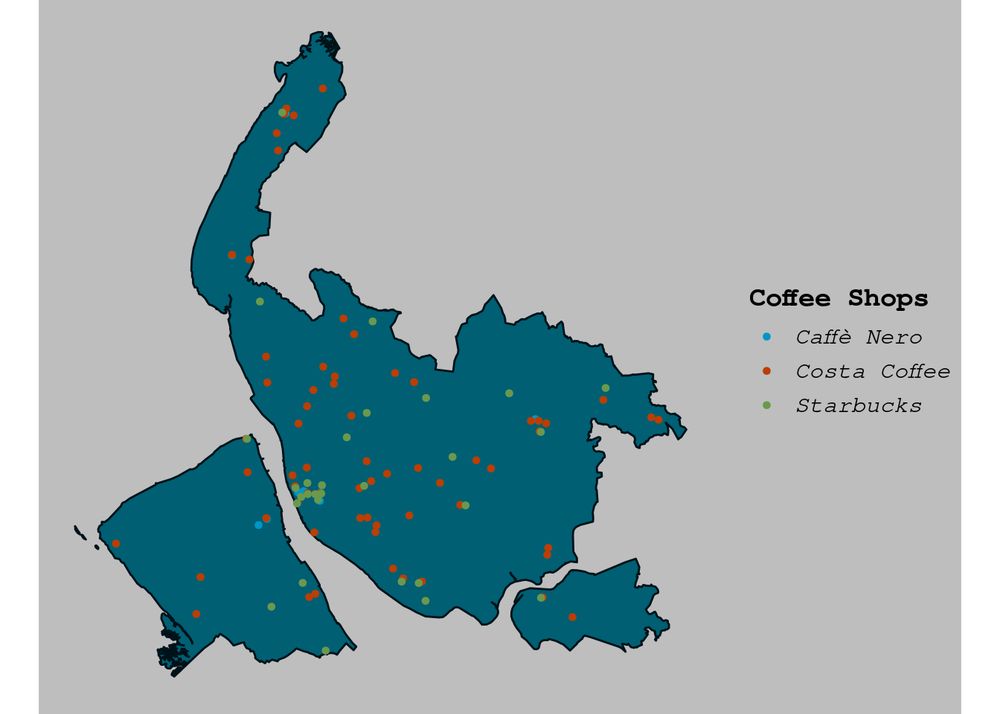
We have been working with these data quite a bit since they arrived and have created ETL to produce an updatable POI dataset for the UK. This #rstats map illustrates how you can use these data to map coffee shops.
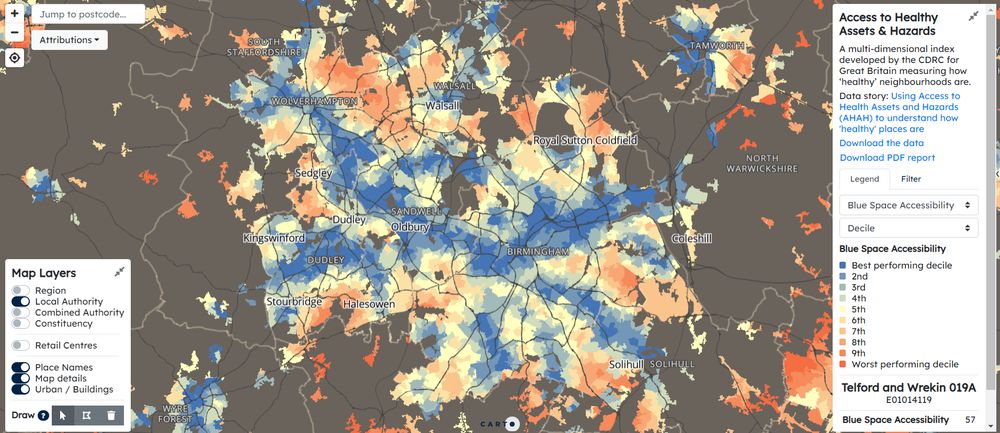
One of the most popular CDRC open data products is our Access to Healthy Assets and Hazards index. This includes a measure of access to bluespace which is today's map. The blog post contains links to the interactive version.
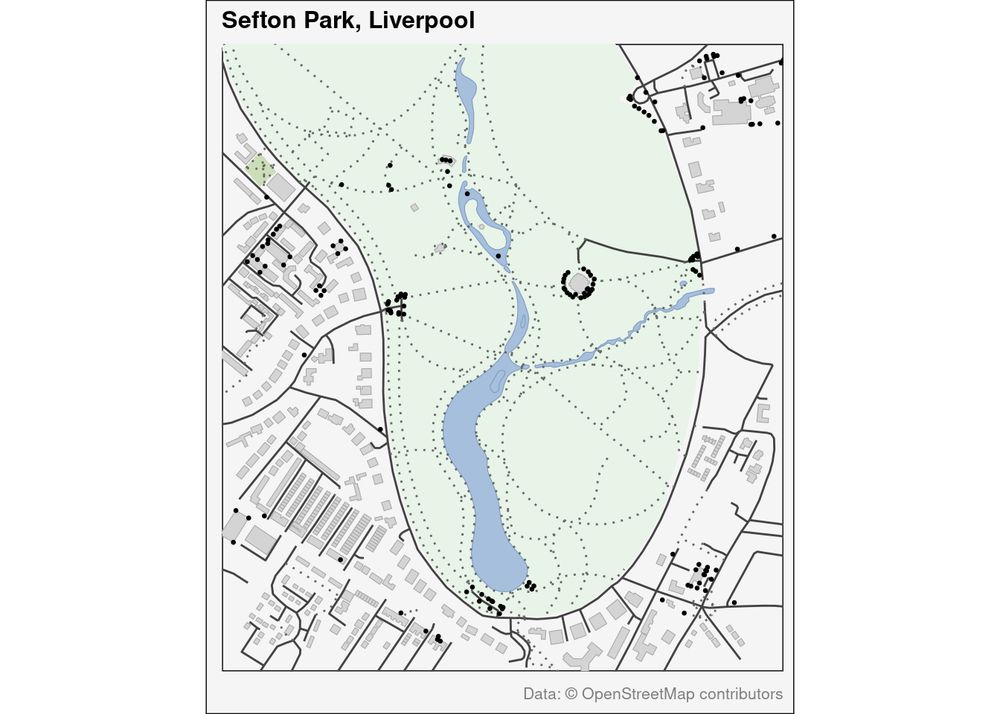
This is a quick example of using #rstats to produce cartography from OpenStreetMap. In this instance a map is create for my local park.
Reposted by: Alex Singleton

Led by @liverpooluni.bsky.social and @ljmuofficial.bsky.social MusicFutures will establish the LCR as a music research and development powerhouse.
👉
news.liverpool.ac.uk/2024/11/27/l...

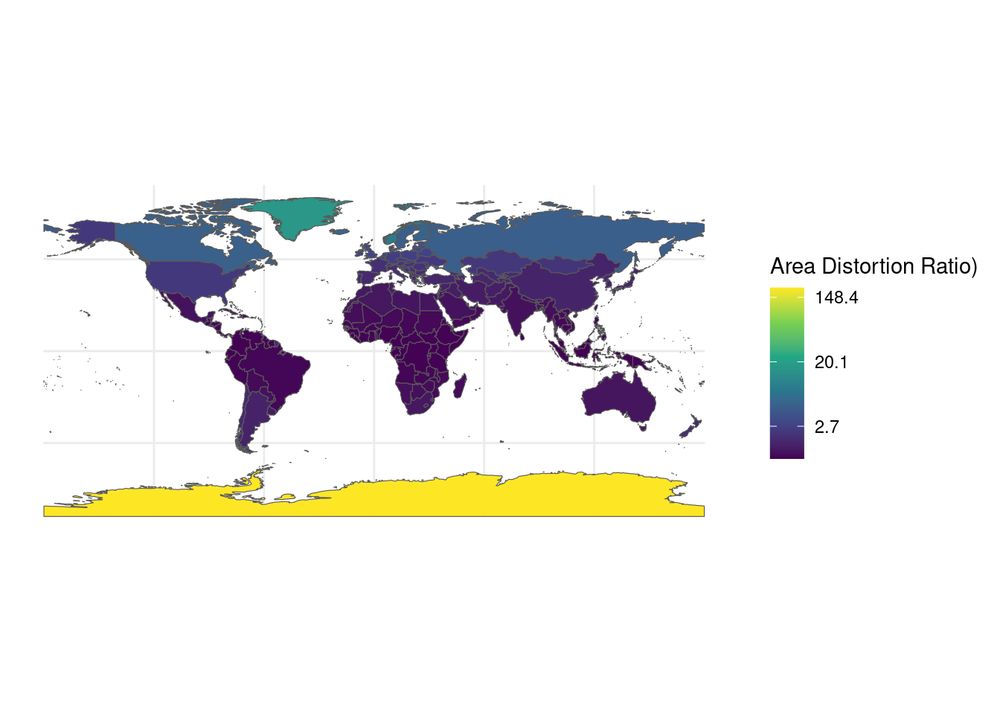
Today is a quick #rstats exploration that compares areas to explore distortion between two projections - the Eckert IV projection and the Mercator projection.
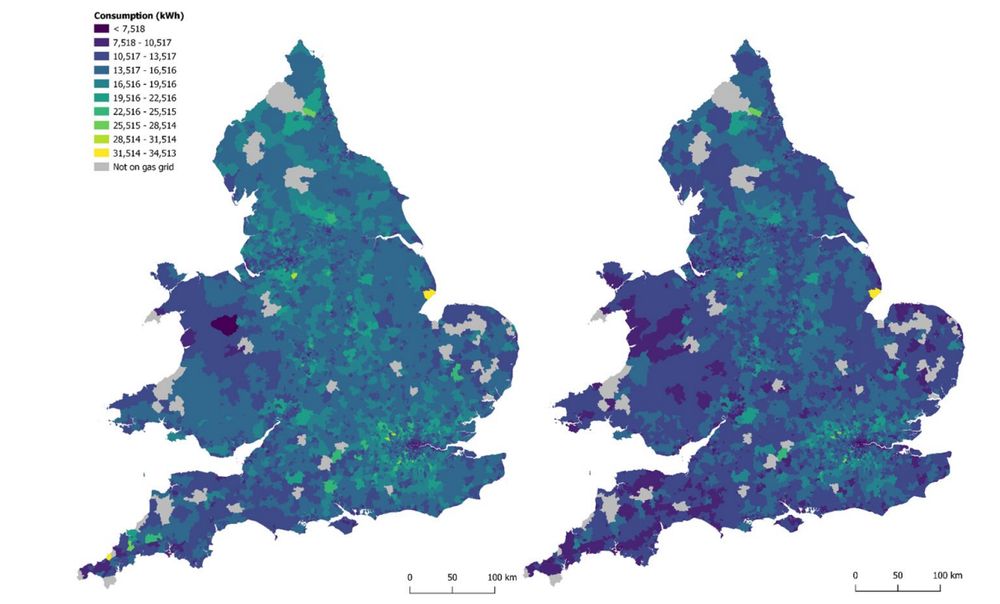
Staying warm is difficult for many people as the price of heating their homes has risen in the UK. In this work we explored the geography of gas consumption trends in the residential sector across England and Wales.
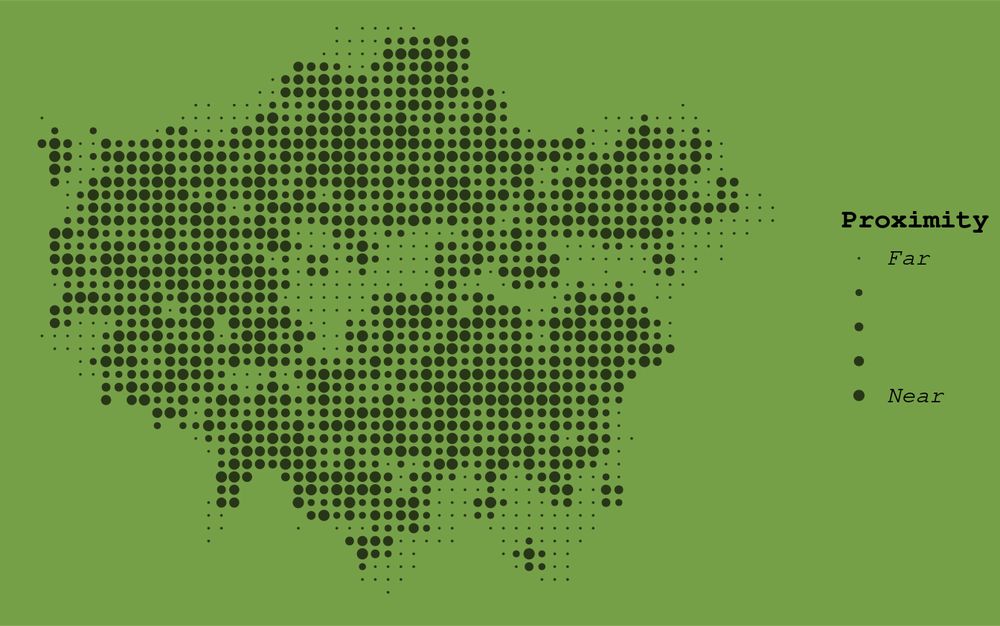
This is another #rstats post which uses Ordnance Survey greenspace data and a simple accessibility measure to map proximity to an allotment in Greater London. The circles are scaled by their proximity.
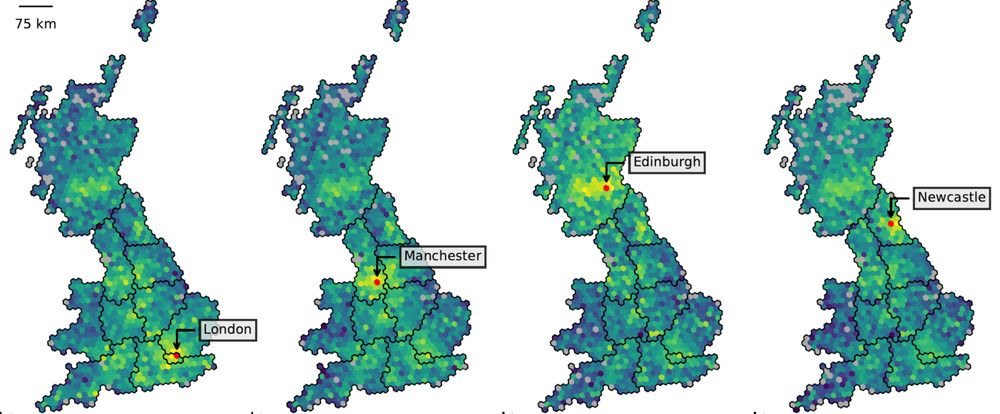
I have taken a collective view on this topic today. This is a map of cognitive geography and place associations extracted from some work looking at where people talk about on Reddit
informationisbeautiful.net/visualizatio...
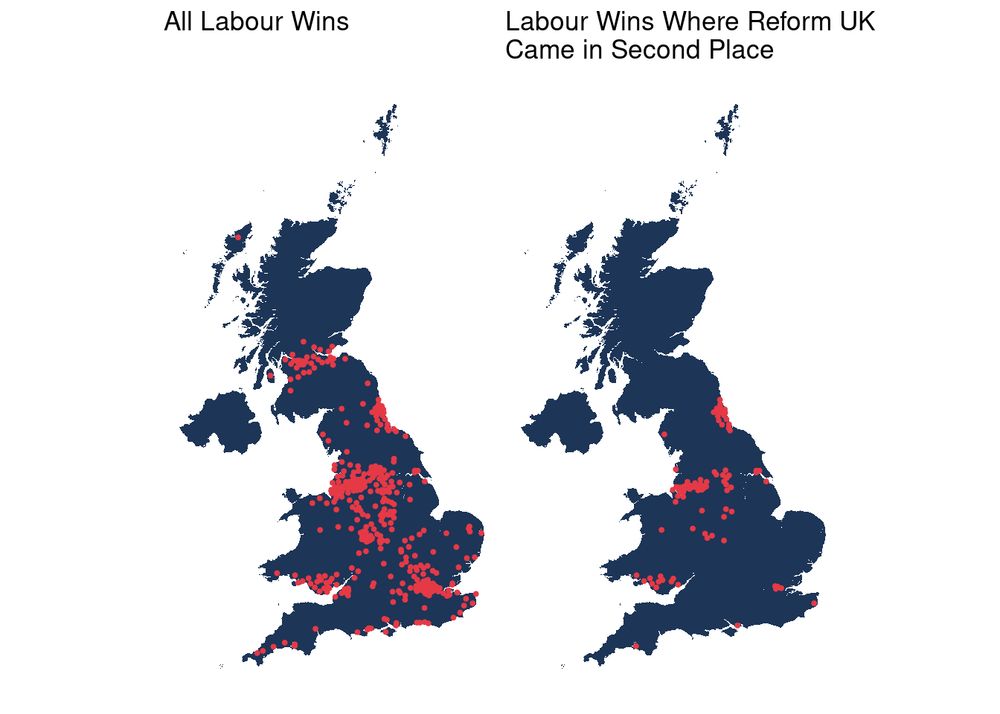
This map was created in #rstats and features just 2 colours. Left is where Labour were the majority party in the 2024 UK General Election. The map on the right is the subset where the Reform party held second place!
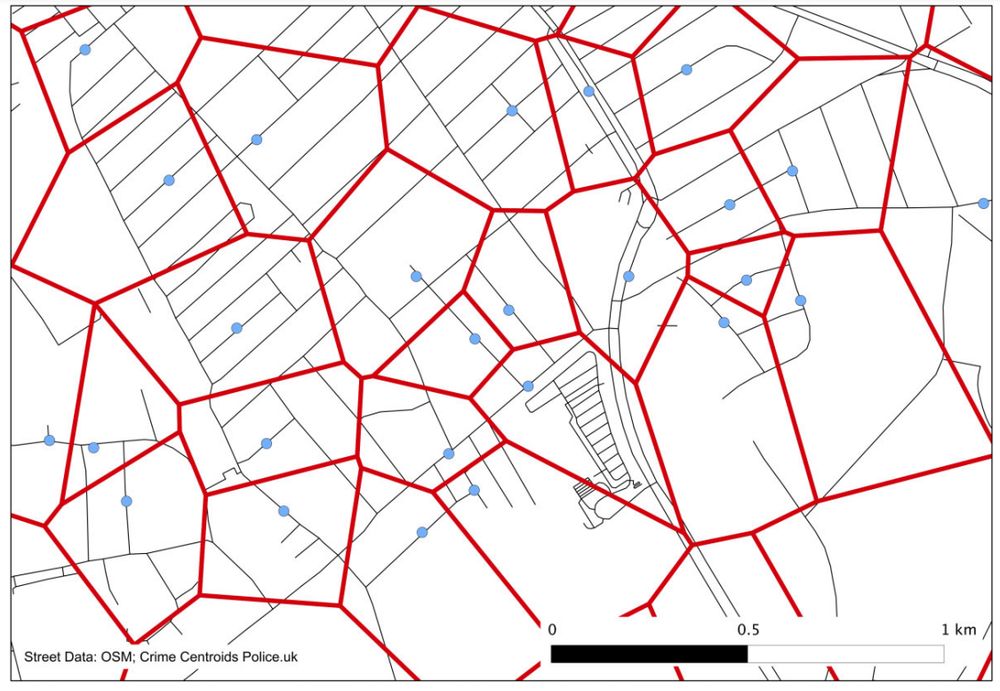
This is not an area that I research in particular, however I have done some work on the visualisation / mapping of UK crime data, and I wrote a short paper about this a reasonable length of time ago!

Todays map is probably interesting to anyone who wants a map of US retail destinations. It is built from a variety of data including OSM using in #rstats and with an interactive website.
