
Bertrand Delouis
@bertranddelouis.bsky.social
140 followers
83 following
44 posts
Seismologist. Geoazur lab.
Observatoire de la Côte d'Azur (OCA)
Université Côte D'Azur (UniCA)
France
Posts
Media
Videos
Starter Packs
Reposted by Bertrand Delouis


Reposted by Bertrand Delouis


Reposted by Bertrand Delouis


Reposted by Bertrand Delouis


Reposted by Bertrand Delouis


Reposted by Bertrand Delouis

Reposted by Bertrand Delouis


Reposted by Bertrand Delouis


Reposted by Bertrand Delouis

Reposted by Bertrand Delouis


Reposted by Bertrand Delouis

![Surface projection of the slip distribution superimposed on GEBCO bathymetry. Thick white lines indicate major plate boundaries [Bird, 2003]. Gray circles, if present, are aftershock locations, sized by magnitude.](https://cdn.bsky.app/img/feed_thumbnail/plain/did:plc:ypwk3a2va4sjhf635v2buswn/bafkreihu5hte2fh2rhq4raxjk3p4y6npgvjdfvnqj5rxeqxafx5tdsxjwa@jpeg)
Reposted by Bertrand Delouis


Reposted by Bertrand Delouis

Stephen Hicks
@seismo-steve.bsky.social
· Mar 28

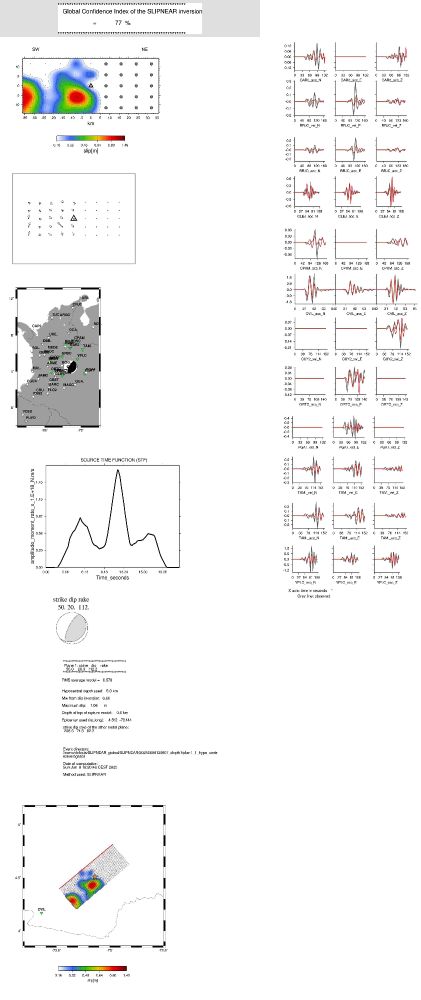
For the M7.7 Myanmar earthquake occurred in 28 March 2025, we produced the… | Hongjun Si
For the M7.7 Myanmar earthquake occurred in 28 March 2025, we produced the following analysis results for emergency response:
(1)Energy radiation from the…
www.linkedin.com