Nick Tierney
@njtierney.bsky.social
540 followers 180 following 170 posts
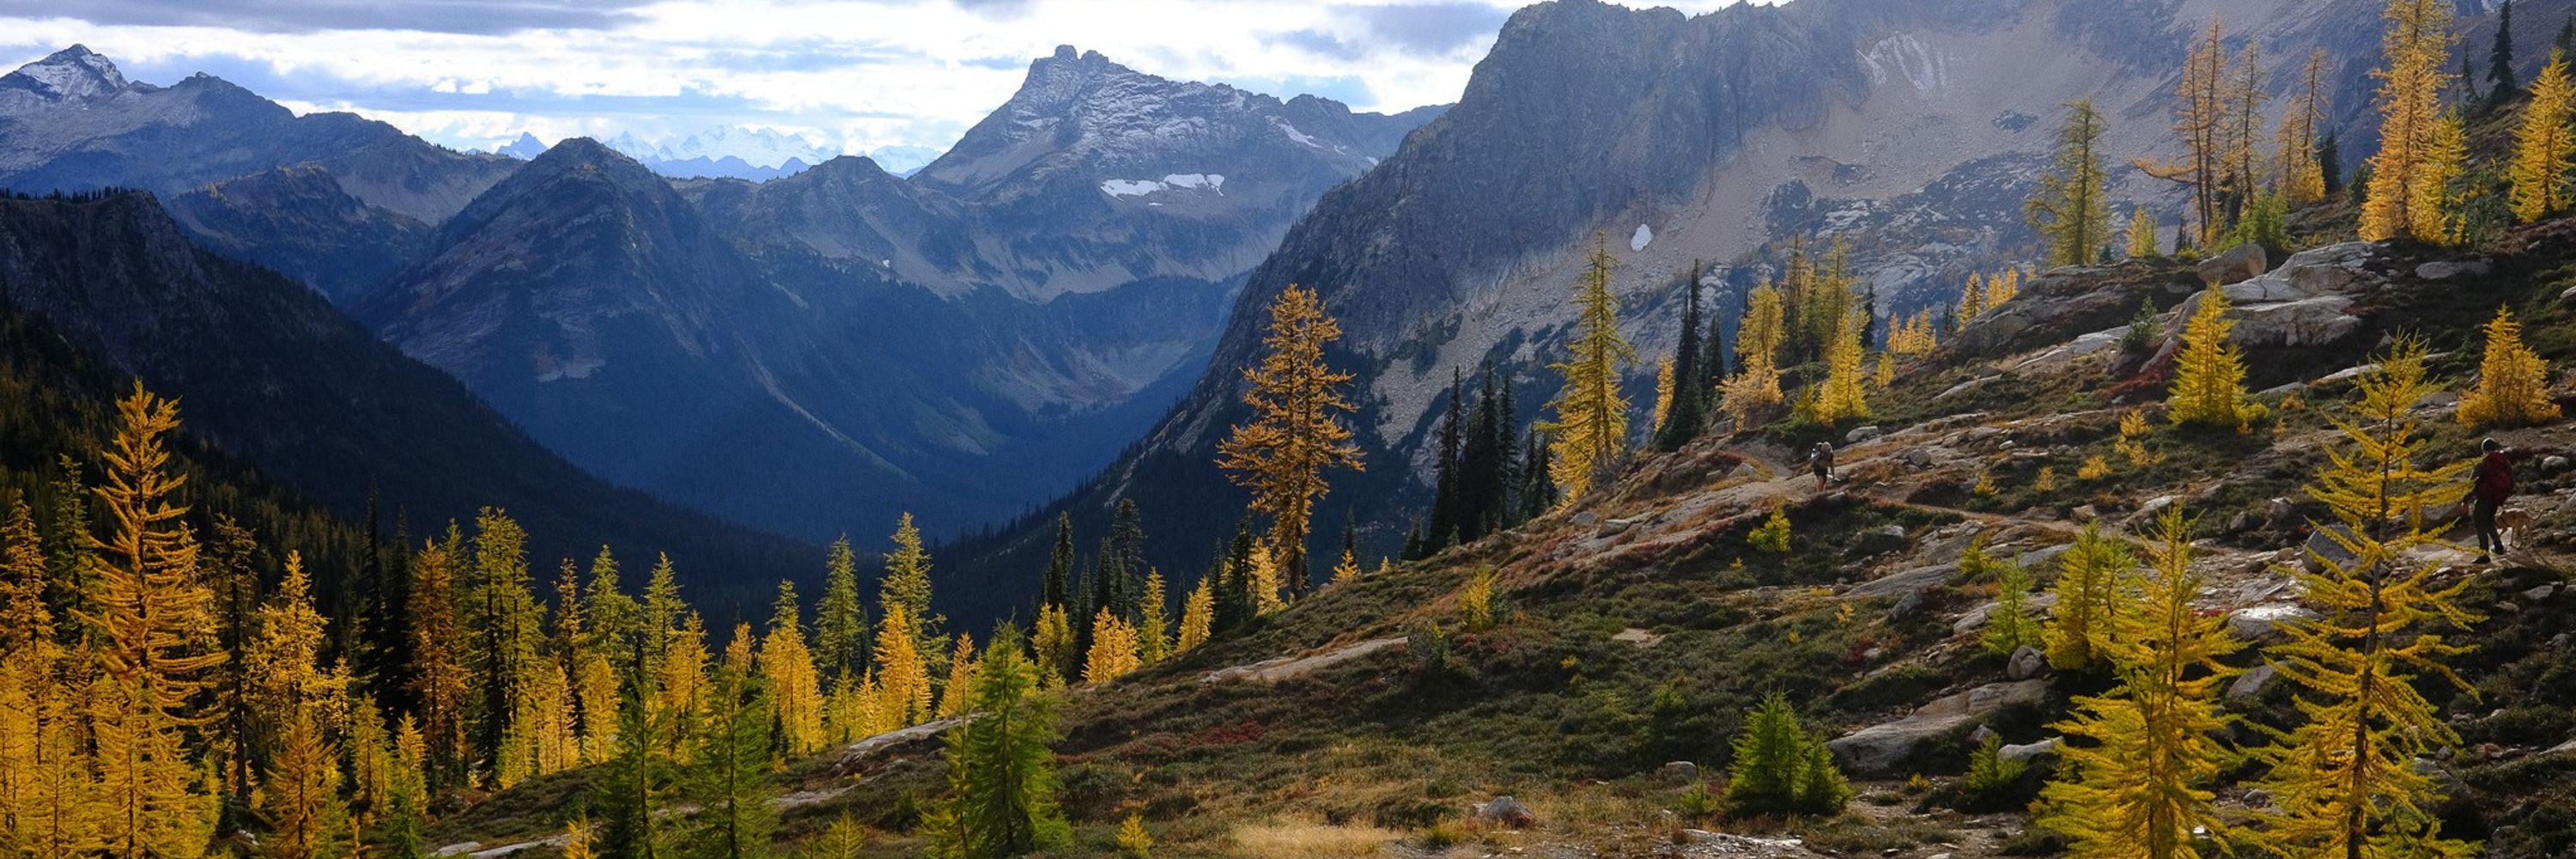
|| PhD Statistics | Research Software Engineer | Loves #rstats | Outdoors person | Coffee person | Photography person | Serial Hobbiest | he/him ||
Posts Media Videos Starter Packs
njtierney.bsky.social
Agreed that summaries can mis represent the data, which I think is why there is a movement to show the data alongside summaries so we can interpret the veracity.
njtierney.bsky.social
Agreed it is important to have the experiment context in there! And fair point that box plots can be confusing to audiences. Any summary will lose information, so showing the data alongside summaries keep them honest. Have you seen the datasaurus dozen? www.research.autodesk.com/publications...
Same Stats, Different Graphs: Generating Datasets with Varied Appearance and Identical Statistics through Simulated Annealing
Why graphical representation and visualization are so important to...
www.research.autodesk.com
Reposted by Nick Tierney
usrbinr.bsky.social
ohh!! that fixed it!

old_hook <- fansi::set_knit_hooks(knitr::knit_hooks, which = c("output", "warning", "error", "message"))
options(crayon.enabled = TRUE)
Reposted by Nick Tierney
ikashnitsky.phd
Amazing quote! I also feel a permanent fascination by the world of *open* source/science/books/courses. The best teachers I had designed open-book exams ❤️
#OpenScience #foss #rstats

Let me suggest a beautiful and extremely relevant talk on this by @drob.bsky.social
🔗 posit.co/resources/vi...
Reposted by Nick Tierney
mwypych.bsky.social
Basketball #tidytuesday

Adventures in {grid} part 2, tried to make a basketball court.

code: github.com/mic-wypych/t...

#rstats | #dataviz | #ggplot2
A plot showing eurobasket teams that made it to final four or won a title on plot styled as a basketbal lcourt
Reposted by Nick Tierney
jrosell.bsky.social
Ross Ihaka used “for each y, find the closest value in x” to illustrate a core #rstats issue: R has no scalar data types.
njtierney.bsky.social
It was! Should be up soon.
njtierney.bsky.social
Amazing, thank you so much!
Reposted by Nick Tierney
leafyericscott.hachyderm.io.ap.brid.gy
I am learning how to make a regular old #rstats #shiny app into a "progressive web app"—one of those websites you can "install" on your phone or desktop and runs full-screen.

It is *not that hard*, but also very much not documented, so I feel like this is going to need to be a blog post eventually.
Reposted by Nick Tierney
mdsumner.bsky.social
#rstats what do folks do when converting from raster to terra with saved data objects? active bindings is a possibility

github.com/ropensci/gra...

interested in any perspectives, I don't want to change the entire way the package works (I'm not the maintainer, just toying with ideas)
njtierney.bsky.social
I'm going to be giving an #rstats talk about functions in about 45 minutes - it's online!

The talk is called: "Practical Functions: Practically Magic", but could potentially be retitled, "Up and Down the Ladder of Abstraction".

Join at: www.meetup.com/slc-rug/even...
Reposted by Nick Tierney
noamross.net
A month or two ago someone posted a link to their really amazing set of LLM system instructions for writing #rstats code with good tidy/NSE patterns. (They were also good for humans!) Does anyone recall who or where that was?
njtierney.bsky.social
Yes! Lots of iteration and mock up drawings in keynote. We were able to go through a local manufacturer in Australia to get a fully custom pattern through a knitting machine. Very neat.
Reposted by Nick Tierney
thomvolker.bsky.social
How cool is this?! Positron opens a HTML color picker when typing a HTML color in your script.

#RStats #dataviz
Reposted by Nick Tierney
shikokuchuo.net
mirai 2.5.1 released.

mirai.r-lib.org

This is a patch release, but brings a new synchronous mode: `daemons(sync = TRUE)` runs your code in the same process. This means you can now drop into a browser session *within* your mirai #rstats code!

p.s. amazing hex stickers made by someone @posit.co!!
mirai R package hex sticker
njtierney.bsky.social
Hands down the UseR 2018 socks! A bit biased but @visnut.bsky.social and I designed them! Don’t have a photo handy, though. We also had a really good strong tote bag that is good for groceries.
Reposted by Nick Tierney
erictleung.bsky.social
recently learned the sQuote() and dQuote() R functions

> cat("distinguish plain", sQuote("single"), "and", dQuote("double"), "quotes")
distinguish plain ‘single’ and “double” quotes
> cat("distinguish between 'single' and \"double\" quotes")
distinguish between 'single' and "double" quotes

#RStats
Reposted by Nick Tierney
daxkellie.bsky.social
🔍 Need to search for species in an area with a buffer? 🔵

Learn how to add a buffer in Python and see how to consider threatened species with obfuscated locations in a new ALA Labs post by Amanda Buyan & me 😀

labs.ala.org.au/posts/2025-0...

🧪🌏 #Python #matplotlib #geopandas #geospatial #quartopub
a map. An outline of Midwestern (a local government area in NSW, Australia) in black surrounded by a buffer zone in blue around it. Purple points (which are species observations) are speckled around the map 3 maps, each showing an black outline of Midwestern (a local government area in NSW, Australia) with a grid overlayed on each. Each map shows a purple dot representing a theoretical 'true' species location, and a yellow point representing the new point location due to generalisation (the process of making the location less precise). These three maps show 3 scenarios when a generalised point appears inside an area when its true location is outside, inside an area when its true location is inside, and outside an area when its true location is inside
njtierney.bsky.social
I'd like my ggplot to blend in to the background slide colour - I thought that setting background or paper to be transparent would solve this, but it doesn't seem to - am I going about this the right way? See an example here: github.com/njtierney/gg...
njtierney.bsky.social
One thing that could be happening is their RStudio session could be storing session objects in .RData, which could be accumulating objects, and hogging all the RAM. You can turn this off in Tools > Global Options > Basic > Workspace. See qmd4sci.njtierney.com/rstudio.html for some recommendations.
3  RStudio, What and Why – Quarto for Scientists
For a scientific report to be completely credible, it must be reproducible. The full computational environment used to derive the results, including the data and code used for statistical analysis sho...
qmd4sci.njtierney.com
Reposted by Nick Tierney
kylewalker.bsky.social
Introducing {pmtiles}: an #rstats package to create, view, and interact with PMTiles.

PMTiles is one of the most exciting geospatial innovations in recent years. Map tiles are stored & served from a single file, making massive geospatial data visualization widely accessible.