Eric Oosenbrug
banner
oosenbrug.bsky.social
Eric Oosenbrug
@oosenbrug.bsky.social
64 followers 110 following 19 posts
🧠 Cognitive Data Strategist | Teaching data to speak human 📊 PhD Psychologist + Gov Data Analyst | Learning dataviz publicly 🐳 Victoria, BC
Posts Media Videos Starter Packs
Reposted by Eric Oosenbrug
Halloween logicals, still the best 10/31 venn
Reposted by Eric Oosenbrug
One of the loudest bells tolling for social science right now is that the decade of abundant data on humans is coming to a close. Whether you work on digital trace or surveys, LLM pollution is a serious problem, even while the wide roll out of LLMs creates an urgent need for social science.
A lot of psych is already conducted with online convenience samples & ppl are probably excited about silicon samples bc it would allow them to crank out more studies for even less 💸

How about we reconsider the idea that sciencey science involves collecting own data.
www.science.org/content/arti...
AI-generated ‘participants’ can lead social science experiments astray, study finds
Data produced by “silicon samples” depends on researchers’ exact choice of models, prompts, and settings
www.science.org
Reposted by Eric Oosenbrug
Re-upping this again. I assisted the amazing team at @onthemedia.bsky.social developing the breaking news consumers handbook, and its recommendations still hold true to this day.
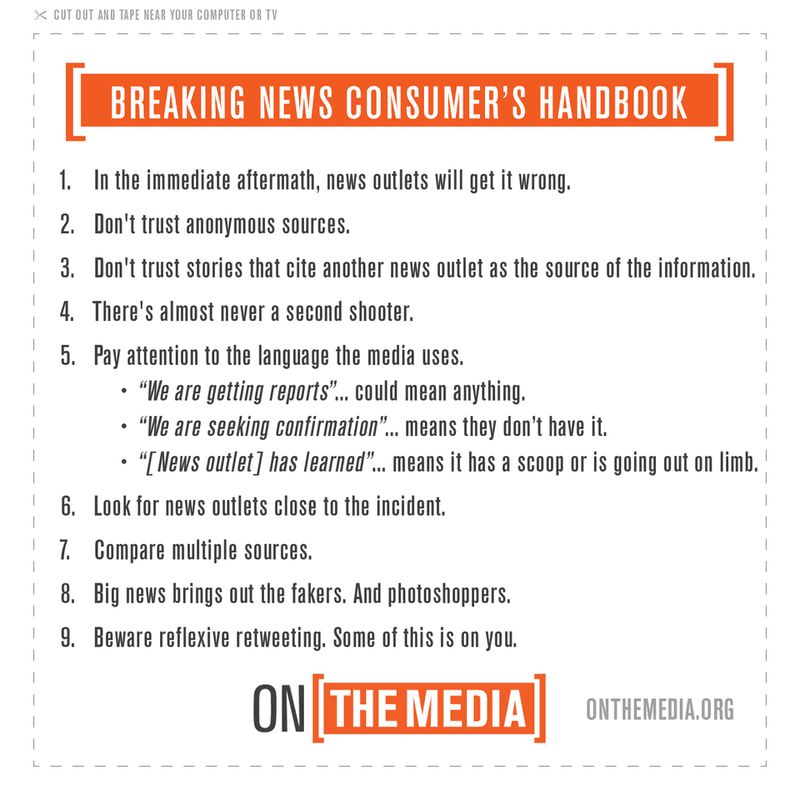
Some helpful tips for following the awful news out of Minnesota today.
Reposted by Eric Oosenbrug
The biological transhumanism and digital eugenics promoted by some of the most powerful people in Silicon Valley amounts to pro-extinctionism, @xriskology.bsky.social‬ writes. www.techpolicy.press/digital-euge...
When Trump demands foreign countries pay tariffs, they're laughing at him 🤡 No country can force another to pay its taxes 🙄 If China imposed taxes on Americans - they'd simply ignore them. US importers pay tariffs, American consumers end up footing the bill #EconomicsExplained #TrumpTariffs 🫡
Reposted by Eric Oosenbrug
Chatbots — LLMs — do not know facts and are not designed to be able to accurately answer factual questions. They are designed to find and mimic patterns of words, probabilistically. When they’re “right” it’s because correct things are often written down, so those patterns are frequent. That’s all.
Σ Waterfall charts are perfect for showing both individual contributions & cumulative impact. Each bar shows how much each subcategory adds to total- you can instantly see which categories drive the biggest changes. Easy in #Tableau with calculated field (sales difference) #dataviz #LearningInPublic
≡ Arrays and matrices are basically the same (unlike in math/programming) because #Tableau treats everything as "rows × columns." Arrays store lists of values, matrices represent data structure - but both are just rectangular grids. I was probably just overthinking this 👀 #dataviz #LearningInPublic
≠ Until recently, I sometimes confused dimensions vs attributes in #Tableau (because they're both categorical) - classic case of surface similarity bias. But now I know dimensions structure your viz (create groups), while attributes just add context (annotate). #dataviz #datapsych #LearningInPublic
🤯 #Tableau hierarchy order matters! I thought they were just groupings but they're drill-down paths (duh). My "database table" mindset made me miss the tree structure hiding in plain sight 🧠
#dataviz #datapsych #LearningInPublic
I resonate with the feeling/need to connect at conferences. I'm new to dataviz and decided not to go ... I regret it. I wish I had met new people and made some new friends. Appreciate the share!
The second edition (on Amazon) is listed as "Volume 1" - is there another volume coming? Just curious
This has absolutely happened to me. It's a good self-reminded to sloooow down :)
This is so helpful Whitney, thank you for sharing! I appreciate you providing these kinds of tips to us data n00bs :)
This looks fantastic and timely! What an amazing line up of researchers. Can't wait to read these essays 💙
Awesome work! I'm so surprised there has never been an Indian dataviz conference - such an important endeavor - best of luck!
Documenting my journey from psych PhD to data storyteller, imposter syndrome and all.
This week: I'm wrestling with basics of data modeling & ETL - guess I missed part about making data usable in my stats classes 😅
What's do you wish someone had told you when you started #dataviz? #LearningInPublic
Reposted by Eric Oosenbrug
I’m Kat Abughazaleh and I approve this message.
Reposted by Eric Oosenbrug
A vibrant scientific community would share this video everywhere. It would engage deeply with its devastating implications and meaningfully discuss alternatives to animal testing.

But instead we scientists are a bunch of cowards, afraid to rock the boat, indoctrinated to rationalize the status quo.
Reposted by Eric Oosenbrug
I really beg datavis researchers to start engaging with this.

The role of the chart here is to provide a cover of objectivity.

It’s reifying the entire fucking opinion section into a 2d space to lens it some Cartesian legitimacy or something equally dark. So, so gross.
We can quibble about the placement of each item but the original sin here is the very existence of this graph. Why on earth would a news organization rank social issues like they're weapons in an RPG?
Of course the NYT sees the "DEI" stuff positively & is neutral on anti-trans discrimination
Reposted by Eric Oosenbrug