


Dr Anna Lombardi
@annalombardi.bsky.social
Climate Data Visualiser @copernicusecmwf.bsky.social 🛰️ 📈🌍🌡️🎨 • @datavizsociety.bsky.social DVS mentor 2025 • Previously physicist @cambridgephysics.bsky.social 🔬 & data journalist @thetimes.com 🗞️ • 🇮🇹 + 🇬🇧 • Views mine
Pinned


The European State of the Climate 2024 report is OUT!
A joint effort by @copernicusecmwf.bsky.social & @wmo-global.bsky.social
Read it & explore all additional resources which include a Graphics gallery, infographics, animations! Enjoy 😊 climate.copernicus.eu/esotc/2024
#dataviz #climate #ESOTC2024
A joint effort by @copernicusecmwf.bsky.social & @wmo-global.bsky.social
Read it & explore all additional resources which include a Graphics gallery, infographics, animations! Enjoy 😊 climate.copernicus.eu/esotc/2024
#dataviz #climate #ESOTC2024
Reposted by Dr Anna Lombardi

La Nina is here and the global cool-down is well underway (global mean sea surface temps are lowest since March 2023).
Remember it's not the individual ups & downs that matter, it's the steady warming trend, which will continue until we reach zero carbon emissions.
#Urgency #StayFocused #COP30
Remember it's not the individual ups & downs that matter, it's the steady warming trend, which will continue until we reach zero carbon emissions.
#Urgency #StayFocused #COP30


November 15, 2025 at 3:31 PM
La Nina is here and the global cool-down is well underway (global mean sea surface temps are lowest since March 2023).
Remember it's not the individual ups & downs that matter, it's the steady warming trend, which will continue until we reach zero carbon emissions.
#Urgency #StayFocused #COP30
Remember it's not the individual ups & downs that matter, it's the steady warming trend, which will continue until we reach zero carbon emissions.
#Urgency #StayFocused #COP30
🇮🇹 To all Italian-speaking contacts & friends 🇮🇹
On Thursday Nov 13th I'll give a talk (in Italian) on 'Dataviz for climate and weather forecast" for the Italian national meteorological service #ItaliaMeteo
Register here if you are interested:
🔗 events.teams.microsoft.com/event/5c333a... #dataviz
On Thursday Nov 13th I'll give a talk (in Italian) on 'Dataviz for climate and weather forecast" for the Italian national meteorological service #ItaliaMeteo
Register here if you are interested:
🔗 events.teams.microsoft.com/event/5c333a... #dataviz
November 10, 2025 at 9:51 AM
🇮🇹 To all Italian-speaking contacts & friends 🇮🇹
On Thursday Nov 13th I'll give a talk (in Italian) on 'Dataviz for climate and weather forecast" for the Italian national meteorological service #ItaliaMeteo
Register here if you are interested:
🔗 events.teams.microsoft.com/event/5c333a... #dataviz
On Thursday Nov 13th I'll give a talk (in Italian) on 'Dataviz for climate and weather forecast" for the Italian national meteorological service #ItaliaMeteo
Register here if you are interested:
🔗 events.teams.microsoft.com/event/5c333a... #dataviz
Reposted by Dr Anna Lombardi

🌡️ 2025 on track to be among top three warmest years. The #C3S Climate Bulletin reports that October was 1.55°C above pre-industrial levels, making it the third-warmest October on record and the first monthly average above 1.5°C since April.
Explore the insights👉 climate.copernicus.eu/surface-air-...
Explore the insights👉 climate.copernicus.eu/surface-air-...
November 7, 2025 at 8:09 AM
🌡️ 2025 on track to be among top three warmest years. The #C3S Climate Bulletin reports that October was 1.55°C above pre-industrial levels, making it the third-warmest October on record and the first monthly average above 1.5°C since April.
Explore the insights👉 climate.copernicus.eu/surface-air-...
Explore the insights👉 climate.copernicus.eu/surface-air-...
Amazing to see @copernicusecmwf.bsky.social Climate Pulse in action, telling important stories around the world.
In case you missed it, we recently released a new version of the app with additional features 🌟
pulse.climate.copernicus.eu
Take a look, find your story, spread the word 🌍🥵🌡️📈 #dataviz
In case you missed it, we recently released a new version of the app with additional features 🌟
pulse.climate.copernicus.eu
Take a look, find your story, spread the word 🌍🥵🌡️📈 #dataviz
October 24, 2025 at 1:24 PM
Amazing to see @copernicusecmwf.bsky.social Climate Pulse in action, telling important stories around the world.
In case you missed it, we recently released a new version of the app with additional features 🌟
pulse.climate.copernicus.eu
Take a look, find your story, spread the word 🌍🥵🌡️📈 #dataviz
In case you missed it, we recently released a new version of the app with additional features 🌟
pulse.climate.copernicus.eu
Take a look, find your story, spread the word 🌍🥵🌡️📈 #dataviz
She did it again!! After an amazing embroidery last year 🪡 here another amazing data-art-take of the #ESOTC cover, this time made out of glass 😍
I wish one day everyone could have a colleague as wonderful, caring and lovely as @rebeccalize.bsky.social
#dataviz #climatecrisis #data4climate
I wish one day everyone could have a colleague as wonderful, caring and lovely as @rebeccalize.bsky.social
#dataviz #climatecrisis #data4climate


October 20, 2025 at 10:55 AM
She did it again!! After an amazing embroidery last year 🪡 here another amazing data-art-take of the #ESOTC cover, this time made out of glass 😍
I wish one day everyone could have a colleague as wonderful, caring and lovely as @rebeccalize.bsky.social
#dataviz #climatecrisis #data4climate
I wish one day everyone could have a colleague as wonderful, caring and lovely as @rebeccalize.bsky.social
#dataviz #climatecrisis #data4climate
Reposted by Dr Anna Lombardi

🚨 Launched: State of Wildfires Report 2024-25
The Americas felt the harsh reality of what it means to live on a more fire-prone planet, with extreme #wildfire episodes made 2-3 times more likely by #climate change.
🔥 Full details via our brand new website: stateofwildfires.com/latest-report/
The Americas felt the harsh reality of what it means to live on a more fire-prone planet, with extreme #wildfire episodes made 2-3 times more likely by #climate change.
🔥 Full details via our brand new website: stateofwildfires.com/latest-report/

October 16, 2025 at 6:36 AM
🚨 Launched: State of Wildfires Report 2024-25
The Americas felt the harsh reality of what it means to live on a more fire-prone planet, with extreme #wildfire episodes made 2-3 times more likely by #climate change.
🔥 Full details via our brand new website: stateofwildfires.com/latest-report/
The Americas felt the harsh reality of what it means to live on a more fire-prone planet, with extreme #wildfire episodes made 2-3 times more likely by #climate change.
🔥 Full details via our brand new website: stateofwildfires.com/latest-report/
🌟 Climate Pulse, our #C3S app to explore climate data, has a new look & a list of additional features 🌟
🧭 improved navigation
🖥️ fullscreen view
📈 more customisable charts
🗺️ new map projections (including Europe and Poles)
Explore it and share your feedback with us!
pulse.climate.copernicus.eu
🧭 improved navigation
🖥️ fullscreen view
📈 more customisable charts
🗺️ new map projections (including Europe and Poles)
Explore it and share your feedback with us!
pulse.climate.copernicus.eu
October 8, 2025 at 12:11 PM
🌟 Climate Pulse, our #C3S app to explore climate data, has a new look & a list of additional features 🌟
🧭 improved navigation
🖥️ fullscreen view
📈 more customisable charts
🗺️ new map projections (including Europe and Poles)
Explore it and share your feedback with us!
pulse.climate.copernicus.eu
🧭 improved navigation
🖥️ fullscreen view
📈 more customisable charts
🗺️ new map projections (including Europe and Poles)
Explore it and share your feedback with us!
pulse.climate.copernicus.eu
Reposted by Dr Anna Lombardi
Meet the team behind a decade of global climate updates, from scientists to analysts and technical experts. These are the people transforming climate data into actionable insight in the monthly #C3S Climate Bulletin.
Read the article climate.copernicus.eu/ten-years-c3...
Read the article climate.copernicus.eu/ten-years-c3...

September 15, 2025 at 12:23 PM
Meet the team behind a decade of global climate updates, from scientists to analysts and technical experts. These are the people transforming climate data into actionable insight in the monthly #C3S Climate Bulletin.
Read the article climate.copernicus.eu/ten-years-c3...
Read the article climate.copernicus.eu/ten-years-c3...
🎙️ I had the immense privilege to talk to @visualisingdata.com about the @copernicusecmwf.bsky.social European State of Climate Report 2024: the role of #dataviz, my sources of inspiration, the link between science & art..
We talked for over an hour, it felt like 10 minutes 🧡
➡️ shorturl.at/8zLn6
We talked for over an hour, it felt like 10 minutes 🧡
➡️ shorturl.at/8zLn6
September 14, 2025 at 4:54 PM
🎙️ I had the immense privilege to talk to @visualisingdata.com about the @copernicusecmwf.bsky.social European State of Climate Report 2024: the role of #dataviz, my sources of inspiration, the link between science & art..
We talked for over an hour, it felt like 10 minutes 🧡
➡️ shorturl.at/8zLn6
We talked for over an hour, it felt like 10 minutes 🧡
➡️ shorturl.at/8zLn6
Reposted by Dr Anna Lombardi
The new Thermal Trace app from #C3S and #ECMWF is here! 80+ years of thermal stress data based on “feels-like” temperatures for any location worldwide, now at your fingertips. Fast, intuitive, interactive – and free! Read our article for the full details and head to the app. 🔗
bit.ly/46ZMllL
bit.ly/46ZMllL
August 20, 2025 at 8:10 AM
The new Thermal Trace app from #C3S and #ECMWF is here! 80+ years of thermal stress data based on “feels-like” temperatures for any location worldwide, now at your fingertips. Fast, intuitive, interactive – and free! Read our article for the full details and head to the app. 🔗
bit.ly/46ZMllL
bit.ly/46ZMllL
Reposted by Dr Anna Lombardi

Excited to share our new app Thermal Trace!
🔗 thermaltrace.climate.copernicus.eu
Thermal stress = health impacts of exposure to extreme thermal conditions (heatwaves, cold spells) Use Thermal Trace to monitor heat & cold stress globally (five days behind real time) & explore changes over time 🥵🥶
🔗 thermaltrace.climate.copernicus.eu
Thermal stress = health impacts of exposure to extreme thermal conditions (heatwaves, cold spells) Use Thermal Trace to monitor heat & cold stress globally (five days behind real time) & explore changes over time 🥵🥶

August 20, 2025 at 9:20 AM
Excited to share our new app Thermal Trace!
🔗 thermaltrace.climate.copernicus.eu
Thermal stress = health impacts of exposure to extreme thermal conditions (heatwaves, cold spells) Use Thermal Trace to monitor heat & cold stress globally (five days behind real time) & explore changes over time 🥵🥶
🔗 thermaltrace.climate.copernicus.eu
Thermal stress = health impacts of exposure to extreme thermal conditions (heatwaves, cold spells) Use Thermal Trace to monitor heat & cold stress globally (five days behind real time) & explore changes over time 🥵🥶
🎙️ Really looking forward to this chat with Andy next week!
Stay tuned for insights and anecdotes about #dataviz & climate science 🌍📈
In the meantime go browse through all 5 past seasons of his podcast: a real treasure of content & inspirational conversations ➡️ visualisingdata.com/podcast/
Stay tuned for insights and anecdotes about #dataviz & climate science 🌍📈
In the meantime go browse through all 5 past seasons of his podcast: a real treasure of content & inspirational conversations ➡️ visualisingdata.com/podcast/

After a few month's gap to help my focus on the juggling act of keeping business ticking over during a move across the sea, next week I will be resuming 'Explore Explain' episode recordings. My next guest is the magnificent Anna Lombardi, and we'll be exploring this vast piece of visual excellence 👇
The European State of the Climate 2024 report is OUT!
A joint effort by @copernicusecmwf.bsky.social & @wmo-global.bsky.social
Read it & explore all additional resources which include a Graphics gallery, infographics, animations! Enjoy 😊 climate.copernicus.eu/esotc/2024
#dataviz #climate #ESOTC2024
A joint effort by @copernicusecmwf.bsky.social & @wmo-global.bsky.social
Read it & explore all additional resources which include a Graphics gallery, infographics, animations! Enjoy 😊 climate.copernicus.eu/esotc/2024
#dataviz #climate #ESOTC2024
July 17, 2025 at 3:13 PM
🎙️ Really looking forward to this chat with Andy next week!
Stay tuned for insights and anecdotes about #dataviz & climate science 🌍📈
In the meantime go browse through all 5 past seasons of his podcast: a real treasure of content & inspirational conversations ➡️ visualisingdata.com/podcast/
Stay tuned for insights and anecdotes about #dataviz & climate science 🌍📈
In the meantime go browse through all 5 past seasons of his podcast: a real treasure of content & inspirational conversations ➡️ visualisingdata.com/podcast/
Reposted by Dr Anna Lombardi
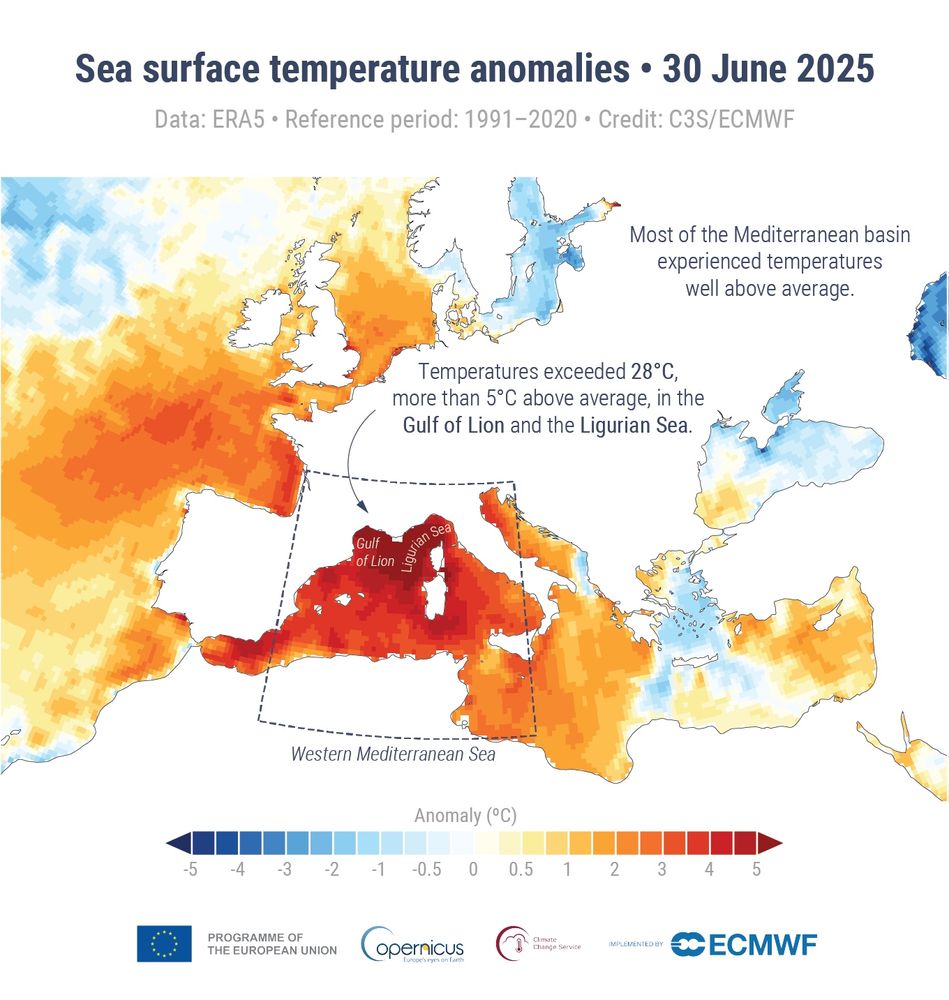
Exceptional Mediterranean water temperatures in June reduced nighttime air cooling along the coasts & increased humidity, worsening heat stress impacts - some coastal areas saw 10-15 tropical nights (when the temperature doesn’t drop below 20°C) last month, when they’d typically see none in June 🥵☀️🌙
July 10, 2025 at 8:31 AM
Exceptional Mediterranean water temperatures in June reduced nighttime air cooling along the coasts & increased humidity, worsening heat stress impacts - some coastal areas saw 10-15 tropical nights (when the temperature doesn’t drop below 20°C) last month, when they’d typically see none in June 🥵☀️🌙
This is one of the most moving #dataviz I've come across in a while.. heartbreaking and so important 💔

Visualizing abstract numbers / actual human beings ... visualizingpalestine.org/gaza-names/e...

Remember their names
Naming the Palestinians who have been killed in Gaza
visualizingpalestine.org
July 10, 2025 at 12:34 PM
This is one of the most moving #dataviz I've come across in a while.. heartbreaking and so important 💔
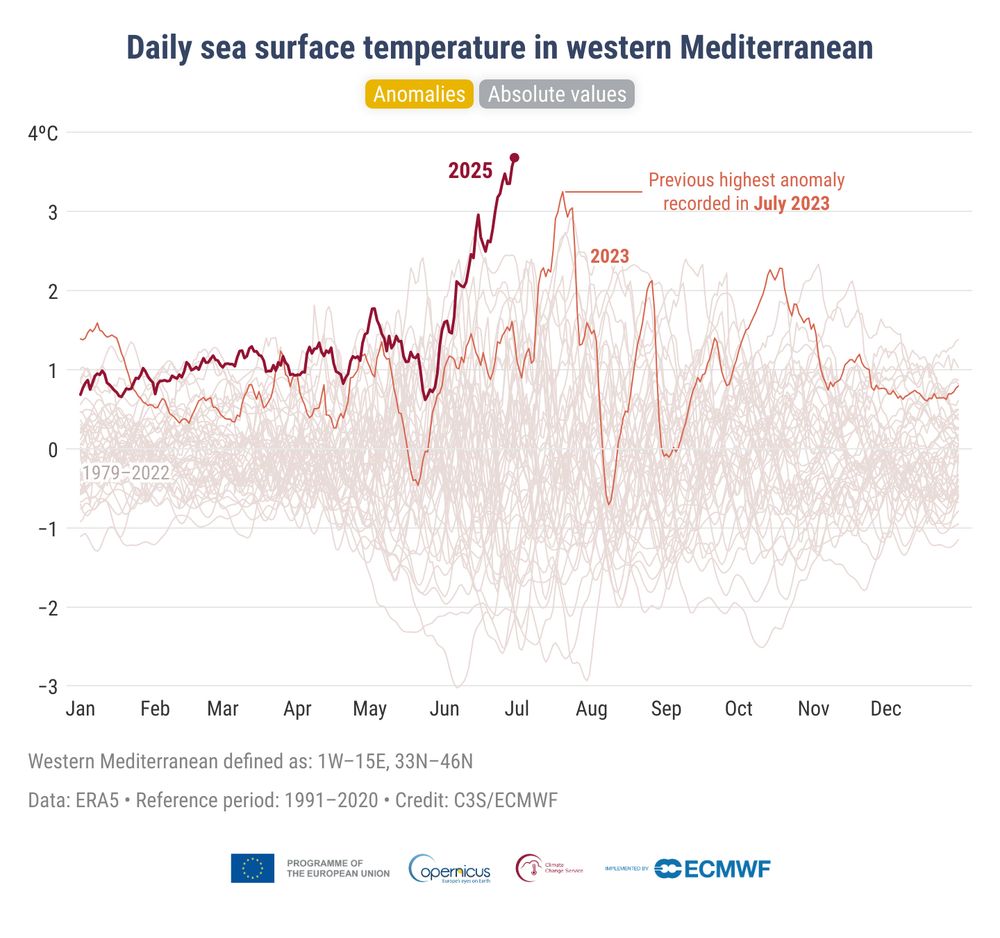
Did June feel much hotter than usual 🥵?
Chances are it was not just a feeling..
🌡️ Large areas of Europe affected by two major heatwaves
🌊 Temperatures in the Western Mediterranean exceptionally high
Latest @copernicusecmwf.bsky.social analysis out today:
🔗 shorturl.at/xpzEv
#climatecrisis #dataviz
Chances are it was not just a feeling..
🌡️ Large areas of Europe affected by two major heatwaves
🌊 Temperatures in the Western Mediterranean exceptionally high
Latest @copernicusecmwf.bsky.social analysis out today:
🔗 shorturl.at/xpzEv
#climatecrisis #dataviz


July 9, 2025 at 10:24 AM
Did June feel much hotter than usual 🥵?
Chances are it was not just a feeling..
🌡️ Large areas of Europe affected by two major heatwaves
🌊 Temperatures in the Western Mediterranean exceptionally high
Latest @copernicusecmwf.bsky.social analysis out today:
🔗 shorturl.at/xpzEv
#climatecrisis #dataviz
Chances are it was not just a feeling..
🌡️ Large areas of Europe affected by two major heatwaves
🌊 Temperatures in the Western Mediterranean exceptionally high
Latest @copernicusecmwf.bsky.social analysis out today:
🔗 shorturl.at/xpzEv
#climatecrisis #dataviz
Reposted by Dr Anna Lombardi

On day 2 of #Outlier2025, we explored what it means to build trust in visualizations, challenge assumptions, and widen our lens on what counts as data, who it's for, and how it's shared.
Let’s keep the momentum going. See you on day 3!
Let’s keep the momentum going. See you on day 3!


June 13, 2025 at 2:23 AM
On day 2 of #Outlier2025, we explored what it means to build trust in visualizations, challenge assumptions, and widen our lens on what counts as data, who it's for, and how it's shared.
Let’s keep the momentum going. See you on day 3!
Let’s keep the momentum going. See you on day 3!
Reposted by Dr Anna Lombardi

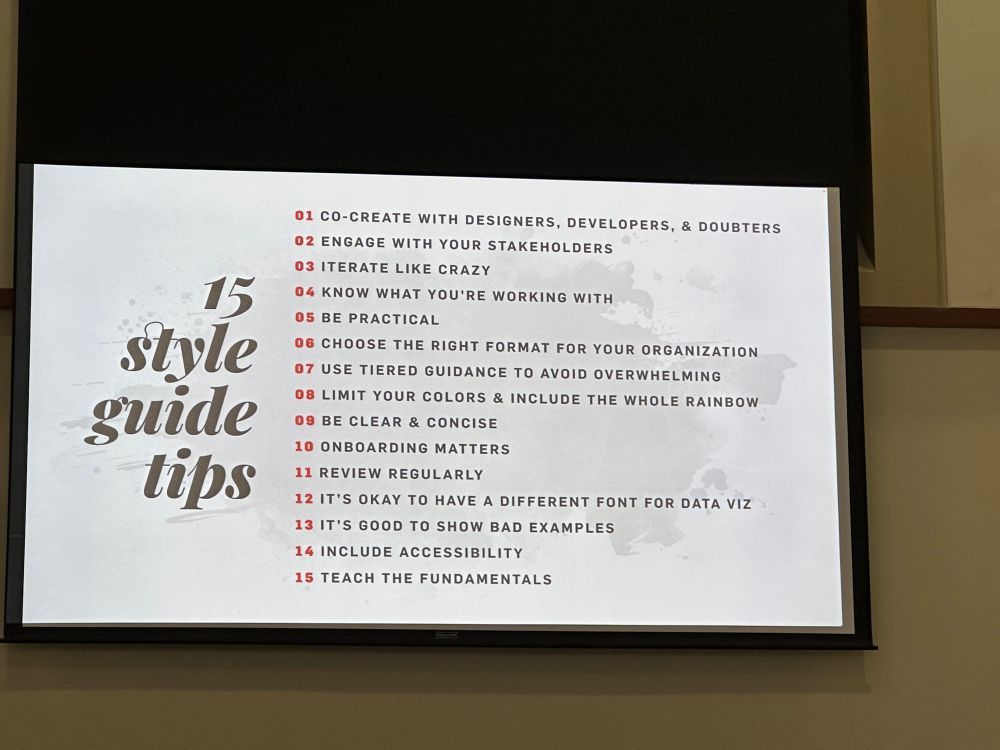
Thankfully @amycesal.com, Max Graze, Alan Wilson and @policyviz.bsky.social managed to get their fifteen style guide tips into one summary slide at #outlier2025 so I didn’t have to pick one!
June 11, 2025 at 6:01 PM
Thankfully @amycesal.com, Max Graze, Alan Wilson and @policyviz.bsky.social managed to get their fifteen style guide tips into one summary slide at #outlier2025 so I didn’t have to pick one!
Reposted by Dr Anna Lombardi
🌡 Out now: the May 2025 #C3S Climate Bulletin reports the second-warmest May globally, 1.4°C above the pre-industrial level. SST reached 20.79°C, marking also the second-highest on record.
Get more temperature insights 🔗 climate.copernicus.eu/surface-air-...
Get more temperature insights 🔗 climate.copernicus.eu/surface-air-...
June 11, 2025 at 7:07 AM
🌡 Out now: the May 2025 #C3S Climate Bulletin reports the second-warmest May globally, 1.4°C above the pre-industrial level. SST reached 20.79°C, marking also the second-highest on record.
Get more temperature insights 🔗 climate.copernicus.eu/surface-air-...
Get more temperature insights 🔗 climate.copernicus.eu/surface-air-...
✍️ My two cents on the role of #dataviz in the #ESOTC2024 report.
The #climatecrisis is the most important story of our times and we need to exploit ALL the tools we have to tell it in the most compelling way and make it resonate with people.
climate.copernicus.eu/role-data-vi...
The #climatecrisis is the most important story of our times and we need to exploit ALL the tools we have to tell it in the most compelling way and make it resonate with people.
climate.copernicus.eu/role-data-vi...
Our ECMWF colleague Dr @annalombardi.bsky.social speaks to the power of data visualisation in telling the story of our evolving climate. From her cover art based on decades of temperature data to 130+ charts, read how data was converted into easy-to-understand graphics in the #ESOTC2024.

May 12, 2025 at 1:02 PM
✍️ My two cents on the role of #dataviz in the #ESOTC2024 report.
The #climatecrisis is the most important story of our times and we need to exploit ALL the tools we have to tell it in the most compelling way and make it resonate with people.
climate.copernicus.eu/role-data-vi...
The #climatecrisis is the most important story of our times and we need to exploit ALL the tools we have to tell it in the most compelling way and make it resonate with people.
climate.copernicus.eu/role-data-vi...
Reposted by Dr Anna Lombardi
Over 130 charts and graphics bring climate data to life in the #ESOTC2024. Data visualisations communicate complex findings in a clear way and are the hallmark of the partnership between #C3S and WMO along with scientists and data providers.
https://bit.ly/4czvQNX
https://bit.ly/4czvQNX

April 22, 2025 at 12:00 PM
Over 130 charts and graphics bring climate data to life in the #ESOTC2024. Data visualisations communicate complex findings in a clear way and are the hallmark of the partnership between #C3S and WMO along with scientists and data providers.
https://bit.ly/4czvQNX
https://bit.ly/4czvQNX
For #ESOTC24 we worked on bespoke infographics to highlight key messages of the report. I especially enjoyed working on this one, in collaboration with scientists and glacier experts at the University of Zurich/WGMS. It shows how glaciers in the Alps have receded over the years 😢
#dataviz #climate
#dataviz #climate

April 17, 2025 at 1:41 PM
The #ESOTC2024 cover aims to grab people's attention & spark curiosity, while offering a visual snapshot of climate conditions in Europe in 2024 🌡️
Started from the same dataset used last year (with one extra datapoint), but I'd say the result is quite different 🏔️
Pick your favourite 😉 #dataviz
Started from the same dataset used last year (with one extra datapoint), but I'd say the result is quite different 🏔️
Pick your favourite 😉 #dataviz

April 15, 2025 at 8:32 AM
The #ESOTC2024 cover aims to grab people's attention & spark curiosity, while offering a visual snapshot of climate conditions in Europe in 2024 🌡️
Started from the same dataset used last year (with one extra datapoint), but I'd say the result is quite different 🏔️
Pick your favourite 😉 #dataviz
Started from the same dataset used last year (with one extra datapoint), but I'd say the result is quite different 🏔️
Pick your favourite 😉 #dataviz
Reposted by Dr Anna Lombardi

The @copernicusecmwf.bsky.social and @wmo-global.bsky.social European State of the Climate Report is launched today
🌐 more than 40 datasets
👩🔬 over 100 scientists
🗺️ > 130 charts and graphics
Check it out: climate.copernicus.eu/ESOTC
🌏🌡️🧪⚒️🌊🛰️
🌐 more than 40 datasets
👩🔬 over 100 scientists
🗺️ > 130 charts and graphics
Check it out: climate.copernicus.eu/ESOTC
🌏🌡️🧪⚒️🌊🛰️
April 15, 2025 at 5:19 AM
The @copernicusecmwf.bsky.social and @wmo-global.bsky.social European State of the Climate Report is launched today
🌐 more than 40 datasets
👩🔬 over 100 scientists
🗺️ > 130 charts and graphics
Check it out: climate.copernicus.eu/ESOTC
🌏🌡️🧪⚒️🌊🛰️
🌐 more than 40 datasets
👩🔬 over 100 scientists
🗺️ > 130 charts and graphics
Check it out: climate.copernicus.eu/ESOTC
🌏🌡️🧪⚒️🌊🛰️
The European State of the Climate 2024 report is OUT!
A joint effort by @copernicusecmwf.bsky.social & @wmo-global.bsky.social
Read it & explore all additional resources which include a Graphics gallery, infographics, animations! Enjoy 😊 climate.copernicus.eu/esotc/2024
#dataviz #climate #ESOTC2024
A joint effort by @copernicusecmwf.bsky.social & @wmo-global.bsky.social
Read it & explore all additional resources which include a Graphics gallery, infographics, animations! Enjoy 😊 climate.copernicus.eu/esotc/2024
#dataviz #climate #ESOTC2024
April 15, 2025 at 6:50 AM
The European State of the Climate 2024 report is OUT!
A joint effort by @copernicusecmwf.bsky.social & @wmo-global.bsky.social
Read it & explore all additional resources which include a Graphics gallery, infographics, animations! Enjoy 😊 climate.copernicus.eu/esotc/2024
#dataviz #climate #ESOTC2024
A joint effort by @copernicusecmwf.bsky.social & @wmo-global.bsky.social
Read it & explore all additional resources which include a Graphics gallery, infographics, animations! Enjoy 😊 climate.copernicus.eu/esotc/2024
#dataviz #climate #ESOTC2024