


Ben Kates (he/him)
@benkates.com
Data Product Engineering and Data Visualization - benkates.com - formerly at the Urban Institute
Earlier this spring, my team at the Urban Institute was impacted by layoffs due to federal revenue cuts. While I’m searching for my next role, I’m excited to share my final project: the Education-to-Workforce Framework Data Tool.
apps.urban.org/features/edu...
apps.urban.org/features/edu...

July 7, 2025 at 8:35 PM
Earlier this spring, my team at the Urban Institute was impacted by layoffs due to federal revenue cuts. While I’m searching for my next role, I’m excited to share my final project: the Education-to-Workforce Framework Data Tool.
apps.urban.org/features/edu...
apps.urban.org/features/edu...
New case study up on my redesigned website! Full process of building a custom #datavisualization tool: brainstorming and prototyping to refining the UX through cross-functional teamwork and creative problem-solving! Inspired by @alv9n.com's great project walkthroughs!

Ben Kates - Case Study: Getting a Good Job Depends More on Race and Gender than Education
Ben is a data-focused technologist based in Philadelphia, PA creating custom data experiences for clients across industries.
benkates.com
July 3, 2025 at 3:33 PM
New case study up on my redesigned website! Full process of building a custom #datavisualization tool: brainstorming and prototyping to refining the UX through cross-functional teamwork and creative problem-solving! Inspired by @alv9n.com's great project walkthroughs!
Reposted by Ben Kates (he/him)

This week, @urbaninstitute.bsky.social launched the Education-to-Workforce Framework data tool.
This was one of the more complex @svelte.dev apps we've built, and @benkates.com led the way on development and made something really cool with this one.
apps.urban.org/features/edu...
This was one of the more complex @svelte.dev apps we've built, and @benkates.com led the way on development and made something really cool with this one.
apps.urban.org/features/edu...


May 15, 2025 at 12:19 PM
This week, @urbaninstitute.bsky.social launched the Education-to-Workforce Framework data tool.
This was one of the more complex @svelte.dev apps we've built, and @benkates.com led the way on development and made something really cool with this one.
apps.urban.org/features/edu...
This was one of the more complex @svelte.dev apps we've built, and @benkates.com led the way on development and made something really cool with this one.
apps.urban.org/features/edu...

Same! The options for detail (compact, stacked, details, list) are very welcome. Plus reminders show up in the individual day too? So good!

November 20, 2024 at 9:45 PM
Same! The options for detail (compact, stacked, details, list) are very welcome. Plus reminders show up in the individual day too? So good!
Attention @datawrapper power users! I built a @raycastapp extension just for YOU! This extension allows you to view, search, open, and duplicate your Datawrapper #datavisualization anywhere on your Mac! Check it out and let me know what you think!
https://www.raycast.com/benkates/datawrapper
https://www.raycast.com/benkates/datawrapper


February 21, 2025 at 3:05 AM
Attention @datawrapper power users! I built a @raycastapp extension just for YOU! This extension allows you to view, search, open, and duplicate your Datawrapper #datavisualization anywhere on your Mac! Check it out and let me know what you think!
https://www.raycast.com/benkates/datawrapper
https://www.raycast.com/benkates/datawrapper
I've been working on my first complex @d3visualization project for the last month and I have to say the #rstats data manipulation skills I've developed work so well with the "custom" aspect of custom viz! Very fun!
February 21, 2025 at 3:05 AM
I've been working on my first complex @d3visualization project for the last month and I have to say the #rstats data manipulation skills I've developed work so well with the "custom" aspect of custom viz! Very fun!
Has anyone come across an #rstats package that converts SQL parameters into structured data? ie:
select * from suez_canal where boat_name = 'Ever Given' and stuck = 'T'
would result in a dataframe with a row:
select * from suez_canal | boat_name = 'Ever Given' | stuck = 'T'
select * from suez_canal where boat_name = 'Ever Given' and stuck = 'T'
would result in a dataframe with a row:
select * from suez_canal | boat_name = 'Ever Given' | stuck = 'T'
February 21, 2025 at 3:05 AM
Has anyone come across an #rstats package that converts SQL parameters into structured data? ie:
select * from suez_canal where boat_name = 'Ever Given' and stuck = 'T'
would result in a dataframe with a row:
select * from suez_canal | boat_name = 'Ever Given' | stuck = 'T'
select * from suez_canal where boat_name = 'Ever Given' and stuck = 'T'
would result in a dataframe with a row:
select * from suez_canal | boat_name = 'Ever Given' | stuck = 'T'
I’ve been on clubhouse for 20 minutes. I’ve never been to sxsw talks but I imagine this is exactly what it’s like
February 21, 2025 at 3:05 AM
I’ve been on clubhouse for 20 minutes. I’ve never been to sxsw talks but I imagine this is exactly what it’s like
I am completely mesmerized by the @Apple homepage this holiday season...love the rotating tech!
February 21, 2025 at 3:05 AM
I am completely mesmerized by the @Apple homepage this holiday season...love the rotating tech!
#immersiveanalytics is the future! Here's a roundup of some of our research into the space! #datastorytelling #AugmentedReality https://x.com/CompassRed/status/1331637480286801927
February 21, 2025 at 3:04 AM
#immersiveanalytics is the future! Here's a roundup of some of our research into the space! #datastorytelling #AugmentedReality https://x.com/CompassRed/status/1331637480286801927
I love online music communities, especially on Twitch. New infographic on the rise of virtual music appreciation this year, built in #GoogleDataStudio! https://datastudio.google.com/reporting/411867ba-a222-4074-9e55-d808d72adf9b/page/tF4fB
February 21, 2025 at 3:04 AM
I love online music communities, especially on Twitch. New infographic on the rise of virtual music appreciation this year, built in #GoogleDataStudio! https://datastudio.google.com/reporting/411867ba-a222-4074-9e55-d808d72adf9b/page/tF4fB
Had a #recentgrad reach out and ask how necessary certifications are for getting that first analyst job. I said understanding of the analyst role + portfolio > certifications, what do you think? #data #rstats #Tableau #GoogleAnalytics
February 21, 2025 at 3:04 AM
Had a #recentgrad reach out and ask how necessary certifications are for getting that first analyst job. I said understanding of the analyst role + portfolio > certifications, what do you think? #data #rstats #Tableau #GoogleAnalytics
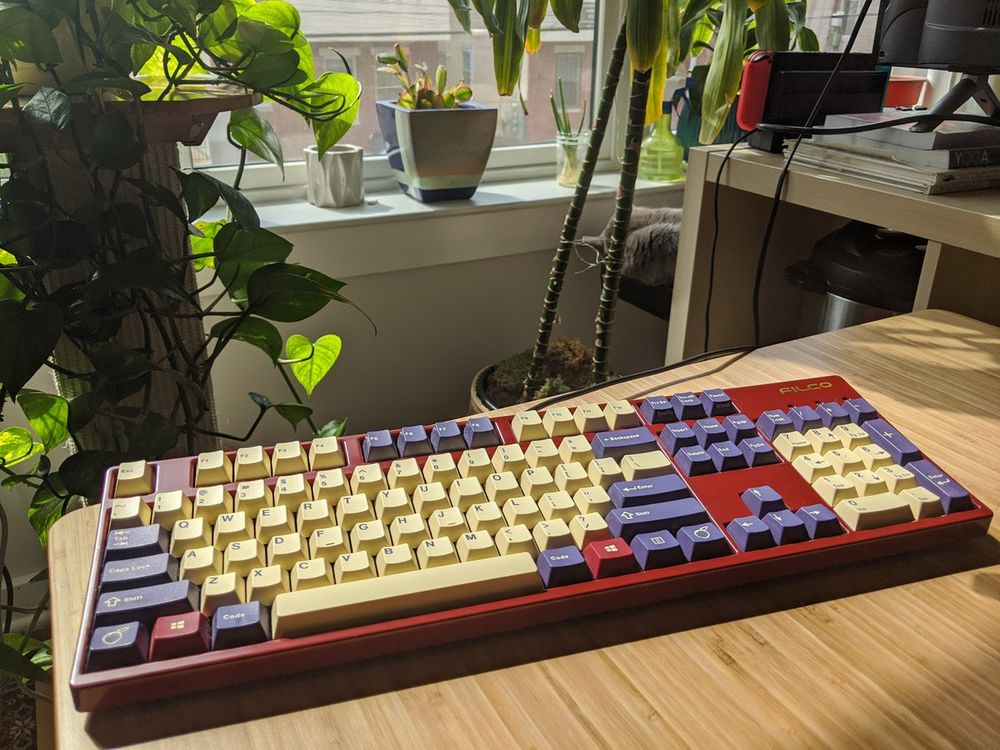
Well I now have an excuse to share my love of mechanical keyboards, thank you @sharlagelfand for creating such a fun #rstats package! Got pretty close recreating mine in ggplot! Frame: Filco Majestouch 2 w/ Silent Red Cherry MX Switches
Keycaps: Jessica GMK Plum from Massdrop https://t.co/qsoixvJDaR
Keycaps: Jessica GMK Plum from Massdrop https://t.co/qsoixvJDaR


February 21, 2025 at 3:04 AM
Well I now have an excuse to share my love of mechanical keyboards, thank you @sharlagelfand for creating such a fun #rstats package! Got pretty close recreating mine in ggplot! Frame: Filco Majestouch 2 w/ Silent Red Cherry MX Switches
Keycaps: Jessica GMK Plum from Massdrop https://t.co/qsoixvJDaR
Keycaps: Jessica GMK Plum from Massdrop https://t.co/qsoixvJDaR
Just spent a little while digging into this tool - a really impressive "big" #rstats #shiny project.
Aside from showing very important data from multiple sources, the frontend/UX is unique and makes use of multiple packages to tie everything together really nicely. Great work! https://t.co/31kz...
Aside from showing very important data from multiple sources, the frontend/UX is unique and makes use of multiple packages to tie everything together really nicely. Great work! https://t.co/31kz...
February 21, 2025 at 3:04 AM
Just spent a little while digging into this tool - a really impressive "big" #rstats #shiny project.
Aside from showing very important data from multiple sources, the frontend/UX is unique and makes use of multiple packages to tie everything together really nicely. Great work! https://t.co/31kz...
Aside from showing very important data from multiple sources, the frontend/UX is unique and makes use of multiple packages to tie everything together really nicely. Great work! https://t.co/31kz...
Excellent overview video of new #GoogleMaps in #GoogleDataStudio from @RiccardoMuti and Tech Writer Rick! https://youtu.be/msMJaF-7rhI

Visualize your data using Google Maps and Data Studio
youtu.be
February 21, 2025 at 3:04 AM
Excellent overview video of new #GoogleMaps in #GoogleDataStudio from @RiccardoMuti and Tech Writer Rick! https://youtu.be/msMJaF-7rhI
Excited to share a #GoogleDataStudio report focused on #selfcare during the #COVID19 pandemic. Hope everyone is doing their best to take good care of themselves and others! Medium: https://t.co/C8xwNqdgMR Report: https://t.co/exr9cC5Y5o #infographic #selfcare @GoogleTrends
February 21, 2025 at 3:04 AM
Excited to share a #GoogleDataStudio report focused on #selfcare during the #COVID19 pandemic. Hope everyone is doing their best to take good care of themselves and others! Medium: https://t.co/C8xwNqdgMR Report: https://t.co/exr9cC5Y5o #infographic #selfcare @GoogleTrends
I've been looking at a lot of #GoogleTrends recently and was surprised to see such a drop in interest for the "Vegetarianism" topic in the US

February 21, 2025 at 3:03 AM
I've been looking at a lot of #GoogleTrends recently and was surprised to see such a drop in interest for the "Vegetarianism" topic in the US
Excited about this one! A @googleanalytics click heatmap viz in #GoogleDataStudio - thanks to @PatStrickler for the original post! Medium Post: https://t.co/YfoTnlmrI6 DS Report: https://t.co/QZ3Lvaf3UV Shoutout @mourner for putting together the JavaScript library #simpleheat!
February 21, 2025 at 3:03 AM
Excited about this one! A @googleanalytics click heatmap viz in #GoogleDataStudio - thanks to @PatStrickler for the original post! Medium Post: https://t.co/YfoTnlmrI6 DS Report: https://t.co/QZ3Lvaf3UV Shoutout @mourner for putting together the JavaScript library #simpleheat!
How do @DrexelUniv, @Penn and @TempleUniv stack up against each other in #socialmedia engagement? Learn more in the new post below! Medium Post: https://t.co/dz6xE0m2fP #GoogleDataStudio Report: https://t.co/IL6z49Pagu

February 21, 2025 at 3:03 AM
How do @DrexelUniv, @Penn and @TempleUniv stack up against each other in #socialmedia engagement? Learn more in the new post below! Medium Post: https://t.co/dz6xE0m2fP #GoogleDataStudio Report: https://t.co/IL6z49Pagu
Thanks for the opportunity + CCG @Lebow for hosting!
My deck from last night can be found below, lots of #GoogleDataStudio links and examples inside!
https://docs.google.com/presentation/d/16-mADPgDge93ABMvt0uMorWvc4jYEFNHLcYze0qIQs8/ https://x.com/bengarvey/status/1225201230194118657
My deck from last night can be found below, lots of #GoogleDataStudio links and examples inside!
https://docs.google.com/presentation/d/16-mADPgDge93ABMvt0uMorWvc4jYEFNHLcYze0qIQs8/ https://x.com/bengarvey/status/1225201230194118657
February 21, 2025 at 3:03 AM
Thanks for the opportunity + CCG @Lebow for hosting!
My deck from last night can be found below, lots of #GoogleDataStudio links and examples inside!
https://docs.google.com/presentation/d/16-mADPgDge93ABMvt0uMorWvc4jYEFNHLcYze0qIQs8/ https://x.com/bengarvey/status/1225201230194118657
My deck from last night can be found below, lots of #GoogleDataStudio links and examples inside!
https://docs.google.com/presentation/d/16-mADPgDge93ABMvt0uMorWvc4jYEFNHLcYze0qIQs8/ https://x.com/bengarvey/status/1225201230194118657
Woah! "Extract theme from image" in #GoogleDataStudio! This is awesome, new? cc: @Helpfullee @wissi_analytics


February 21, 2025 at 3:03 AM
Woah! "Extract theme from image" in #GoogleDataStudio! This is awesome, new? cc: @Helpfullee @wissi_analytics
Before @googleanalytics there was @urchinbiz! Fascinating read from Scott Crosby - great to understand the roots of a tool you use everyday!
https://urchin.biz/urchin-software-corp-89a1f5292999
https://urchin.biz/urchin-software-corp-89a1f5292999

Urchin Software Corp.
The unlikely origin story of Google Analytics, 1996–2005-ish
urchin.biz
February 21, 2025 at 3:03 AM
Before @googleanalytics there was @urchinbiz! Fascinating read from Scott Crosby - great to understand the roots of a tool you use everyday!
https://urchin.biz/urchin-software-corp-89a1f5292999
https://urchin.biz/urchin-software-corp-89a1f5292999
New post! Learn how to create a custom Google Analytics #rshiny application using #deckgl + @Mapbox (source code + app template included) Thanks to @HoloMarkeD for all of the #rstats GA 📦 development! https://medium.com/compassred-data-blog/google-analytics-dashboards-in-r-shiny-fc8e0ebcef2c


February 21, 2025 at 3:03 AM
New post! Learn how to create a custom Google Analytics #rshiny application using #deckgl + @Mapbox (source code + app template included) Thanks to @HoloMarkeD for all of the #rstats GA 📦 development! https://medium.com/compassred-data-blog/google-analytics-dashboards-in-r-shiny-fc8e0ebcef2c
Some very charty gifts this season!

February 21, 2025 at 3:02 AM
Some very charty gifts this season!