


Brenda Ekwurzel
@brendaekwurzel.bsky.social
Scientist at Union of Concerned Scientists
Handy visual of “life cycle” (i.e. manufacturing + installation + operation + decommissioning) of energy emissions of heat-trapping carbon dioxide equivalent (CO2e) based on NREL data with visual available at UCS. www.ucs.org/resources/be...

July 18, 2025 at 2:24 PM
Handy visual of “life cycle” (i.e. manufacturing + installation + operation + decommissioning) of energy emissions of heat-trapping carbon dioxide equivalent (CO2e) based on NREL data with visual available at UCS. www.ucs.org/resources/be...
Reposted by Brenda Ekwurzel

“We all know the Treaty is a crucial instrument to protect our Ocean beyond borders. And indeed, we made it – the Treaty was agreed and adopted. And today, we are inches away from the 60 signatures for ratification.” @vonderleyen.ec.europa.eu
18 New Countries Ratify High Seas Treaty at 2025 UN Ocean Conference - EcoWatch
At the United Nations Ocean Conference, 18 new countries ratified the High Seas Treaty for a total of 49 — just 11 shy of the 60 needed.
www.ecowatch.com
June 11, 2025 at 12:01 AM
“We all know the Treaty is a crucial instrument to protect our Ocean beyond borders. And indeed, we made it – the Treaty was agreed and adopted. And today, we are inches away from the 60 signatures for ratification.” @vonderleyen.ec.europa.eu
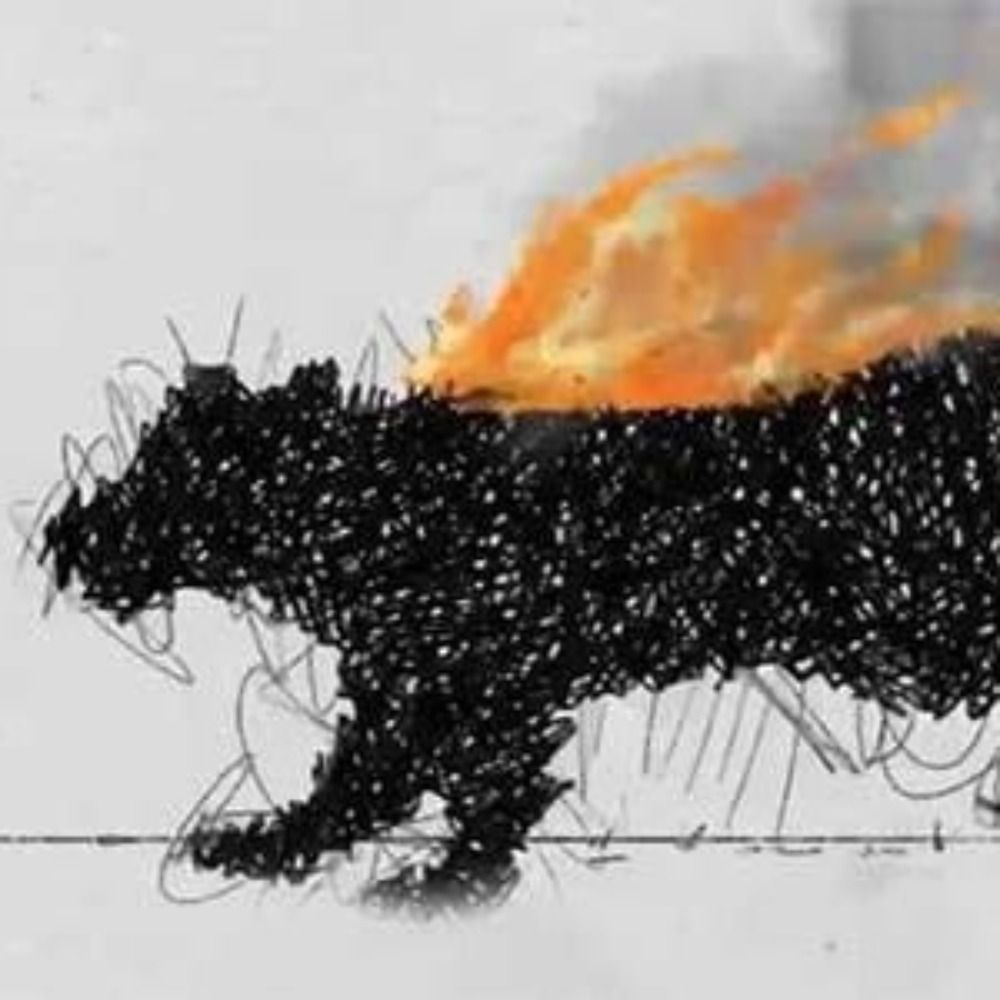
Michela Biasutti, research professor @lamont.columbia.edu hosts hour 43 during 100-hr @wclivestream.bsky.social when Carly Phillips, scientist @ucs.org explains drivers of wildfires 🔥(see image ⬇️ with research findings by @climate-guy.bsky.social & @emilywilliams.bsky.social)

May 30, 2025 at 12:02 PM
Michela Biasutti, research professor @lamont.columbia.edu hosts hour 43 during 100-hr @wclivestream.bsky.social when Carly Phillips, scientist @ucs.org explains drivers of wildfires 🔥(see image ⬇️ with research findings by @climate-guy.bsky.social & @emilywilliams.bsky.social)
Rudra Thaker, host, displayed question after @rschumacher.cloud presentation during @wclivestream.bsky.social. ➡️Human forecasters assess computer models and add their local knowledge to provide better forecasts regarding small scale extreme weather consequences that matter to people.

May 29, 2025 at 3:26 PM
Rudra Thaker, host, displayed question after @rschumacher.cloud presentation during @wclivestream.bsky.social. ➡️Human forecasters assess computer models and add their local knowledge to provide better forecasts regarding small scale extreme weather consequences that matter to people.
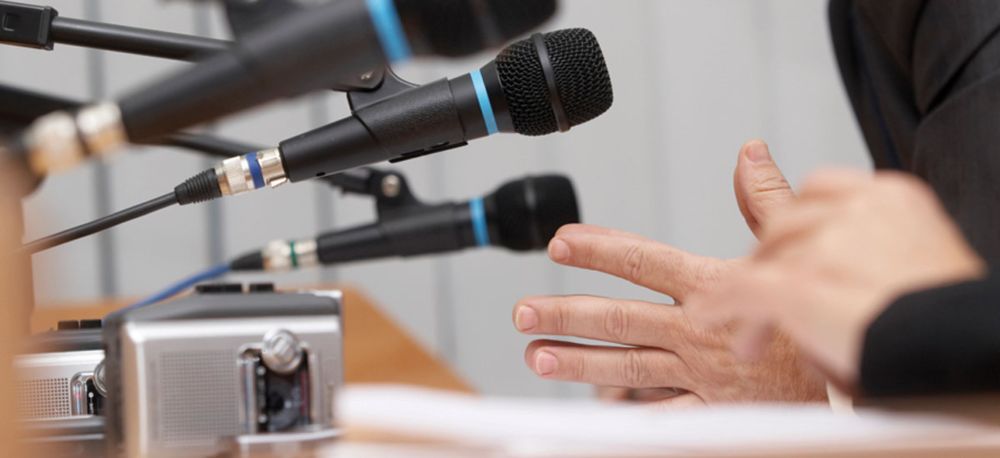
Tune in to panel moderated by Marc Alessi @marc-alessi.bsky.social on @wclivestream.bsky.social and take the opportunity to ask your question directly to those who know NOAA from the inside:

May 28, 2025 at 8:37 PM
Tune in to panel moderated by Marc Alessi @marc-alessi.bsky.social on @wclivestream.bsky.social and take the opportunity to ask your question directly to those who know NOAA from the inside:
Aaron Evans captured the enthusiasm for Kate Marvel’s @drkatemarvel.bsky.social dynamic presentation during @wclivestream.bsky.social – “Dr. Marvel. The Captain Marvel we NEED”

May 28, 2025 at 8:13 PM
Aaron Evans captured the enthusiasm for Kate Marvel’s @drkatemarvel.bsky.social dynamic presentation during @wclivestream.bsky.social – “Dr. Marvel. The Captain Marvel we NEED”
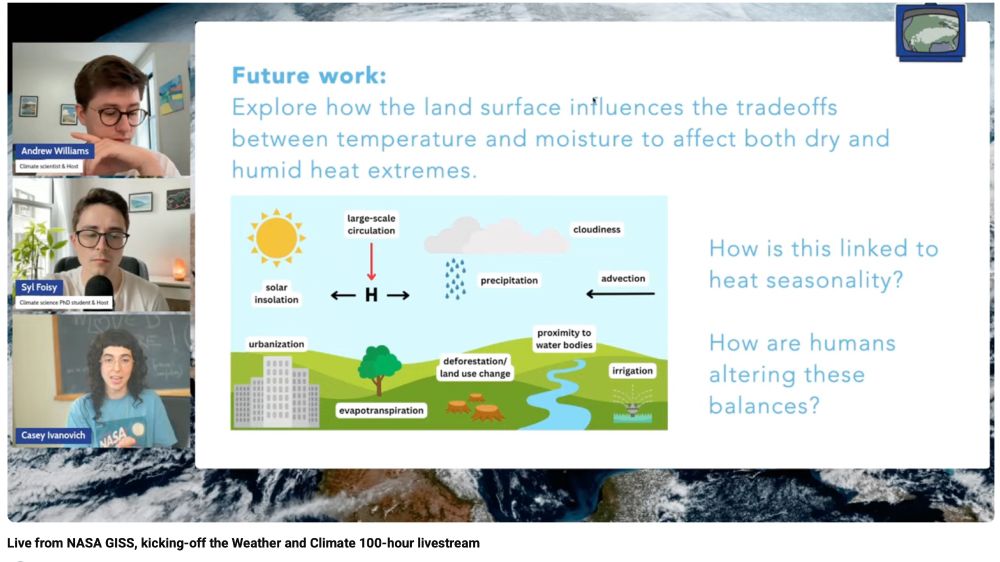
Casey Ivanovich @ccivanovich.bsky.social shared during @wclivestream.bsky.social the factors influencing dangerous extreme heat events plus a public communication tip for conveying the difference between humid and dry heat extremes – “sticky” vs “crispy”
May 28, 2025 at 7:08 PM
Casey Ivanovich @ccivanovich.bsky.social shared during @wclivestream.bsky.social the factors influencing dangerous extreme heat events plus a public communication tip for conveying the difference between humid and dry heat extremes – “sticky” vs “crispy”
Tune in at the top of the hour 1PM ET for live from NASA GISS:

The 100-hour long Weather & Climate Livestream starts today (wclivestream.com)! Join us at 1pm ET live from NASA GISS lab. After, we'll hear from a panel of fired NOAA scientists, a panel of former NWS Directors, and keynotes by an incredible lineup of climate scientists and meteorologists!

May 28, 2025 at 4:05 PM
Tune in at the top of the hour 1PM ET for live from NASA GISS:
Preserving Federal Science Advice: Opportunities for Independent Science Advisory Committees secure.ucs.org/a/2025-05-22...
Preserving Federal Science Advice: Opportunities for Independent Science Advisory Committees
The Union of Concerned Scientists invites you to our webinar on how scientists and experts can support the continuation of policy-relevant science advice, even when federal advisory committees are dis...
secure.ucs.org
May 19, 2025 at 2:11 PM
Preserving Federal Science Advice: Opportunities for Independent Science Advisory Committees secure.ucs.org/a/2025-05-22...
Tracing Tides: How Major Carbon Producers Drive Sea Level Rise and Climate Injustice secure.ucs.org/a/2025-5-14-...

Tracing Tides: How Major Carbon Producers Drive Sea Level Rise and Climate Injustice
The Union of Concerned Scientists invites you to a virtual discussion to learn about how big polluters’ past emissions are driving current global warming and future sea level rise. Wednesday, May 14, ...
secure.ucs.org
May 9, 2025 at 8:25 PM
Tracing Tides: How Major Carbon Producers Drive Sea Level Rise and Climate Injustice secure.ucs.org/a/2025-5-14-...
April 30, 2025 at 2:55 PM
📣 Scientists can sign onto this letter concerning the Central Arctic Ocean ecosystems with Ocean Conservancy and Oceans North
nam04.safelinks.protection.outlook.com?url=https%3A...
nam04.safelinks.protection.outlook.com?url=https%3A...

Letter from Scientists concerning the Central Arctic Ocean
We, the undersigned scientists, call on Arctic governments to take a lead in developing an international agreement that protects the CAO and its ecosystems, adopts a precautionary approach based on
In...
nam04.safelinks.protection.outlook.com
April 7, 2025 at 1:43 PM
📣 Scientists can sign onto this letter concerning the Central Arctic Ocean ecosystems with Ocean Conservancy and Oceans North
nam04.safelinks.protection.outlook.com?url=https%3A...
nam04.safelinks.protection.outlook.com?url=https%3A...
The Arctic wintertime 🥶 when we expect to see maximum sea ice 🧊area ➡️ check out what happened…
The peak of Arctic winter sea ice has hit a record-breaking low, say NASA and NSIDC scientists, continuing a warming trend in the region faster than the earth as a whole. www.nasa.gov/earth/arctic...

NASA, NSIDC Scientists Say Arctic Winter Sea Ice at Record Low - NASA
Winter sea ice cover in the Arctic was the lowest it's ever been at its annual peak on March 22, 2025, according to NASA and the National Snow and Ice Data Center (NSIDC) at the University of Colorado...
www.nasa.gov
March 28, 2025 at 7:15 PM
The Arctic wintertime 🥶 when we expect to see maximum sea ice 🧊area ➡️ check out what happened…
Reposted by Brenda Ekwurzel
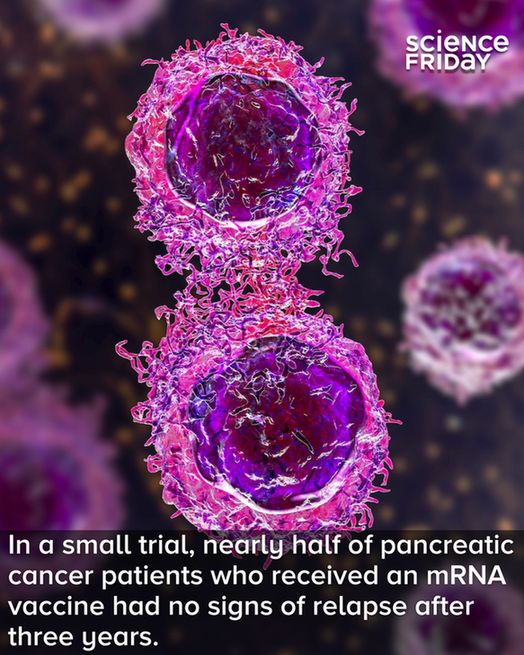
Pancreatic cancer is notoriously hard to treat, with a mortality rate of about 90%.
In today’s episode, we talk with a scientist who is fighting the cancer with an mRNA vaccine.
Listen here 🎧:
https://buff.ly/3ES4ndw
In today’s episode, we talk with a scientist who is fighting the cancer with an mRNA vaccine.
Listen here 🎧:
https://buff.ly/3ES4ndw
February 26, 2025 at 7:19 PM
Pancreatic cancer is notoriously hard to treat, with a mortality rate of about 90%.
In today’s episode, we talk with a scientist who is fighting the cancer with an mRNA vaccine.
Listen here 🎧:
https://buff.ly/3ES4ndw
In today’s episode, we talk with a scientist who is fighting the cancer with an mRNA vaccine.
Listen here 🎧:
https://buff.ly/3ES4ndw
Apparently there are more than 300 words for snow and ice in this soon to be released polar dictionary ➡️ "Cold Words" ❄️

Cosmos shared their 3 favourite words from our upcoming release, Cold Words: A Polar Dictionary by Bernadette Hince. cosmosmagazine.com/news/cold-wo...
What are your favourite "cold words"?
The book is aimed at researchers, professionals & word nerds. Find it in book stores & libraries from April.
What are your favourite "cold words"?
The book is aimed at researchers, professionals & word nerds. Find it in book stores & libraries from April.

Cold Words: the making of a polar dictionary
Travelling to the ends of the Earth is an extreme experience thanks to the environment... and the language. Bernadette Hince has crafted Cold Words: A Polar
cosmosmagazine.com
February 25, 2025 at 2:52 PM
Apparently there are more than 300 words for snow and ice in this soon to be released polar dictionary ➡️ "Cold Words" ❄️