


Charlotte McClintock
@cmcclintock.bsky.social
tracking clean tech investment and the state of the US energy transition @rhodiumgroup.bsky.social. professional data obsessive, amateur ceramic apprentice. new-ish Seattleite. newly energy-pilled. show me your coolest charts.
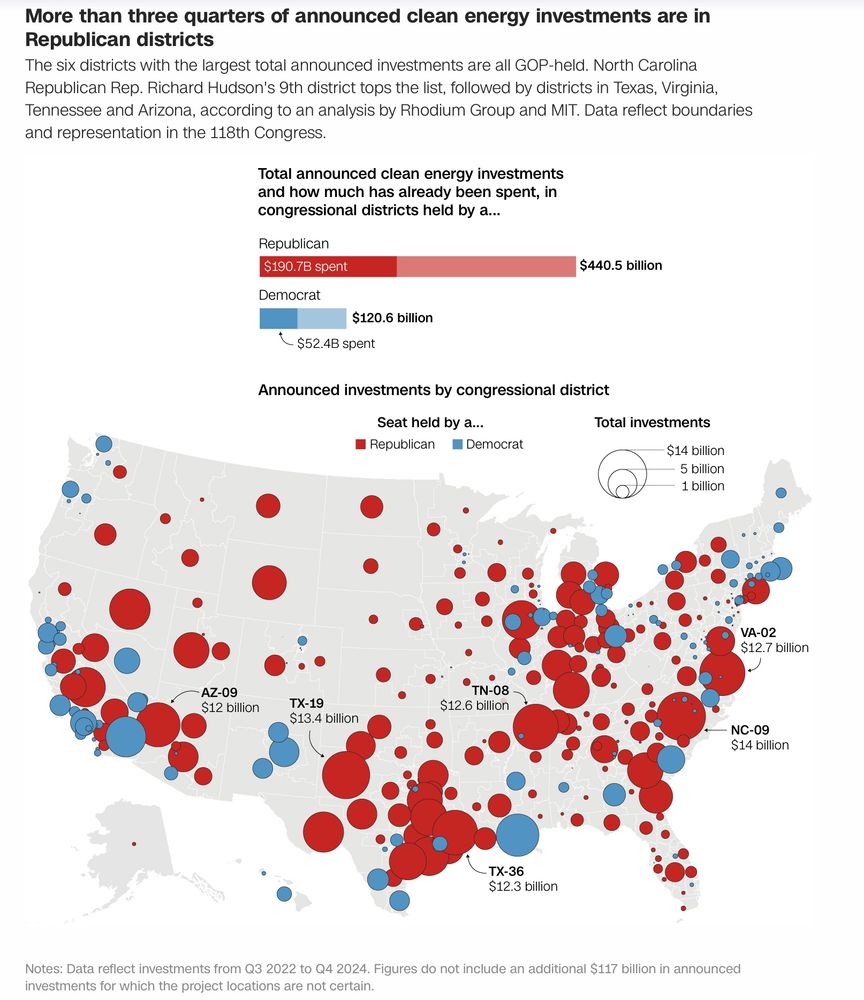
New out today from my team @rhodiumgroup.bsky.social - $321B has been invested since the passage of the IRA in Q3 2022 and $522B is currently outstanding, including projects that are announced or under construction. 75% of outstanding investment is in R districts. (fig below from NYT)

May 13, 2025 at 4:11 PM
New out today from my team @rhodiumgroup.bsky.social - $321B has been invested since the passage of the IRA in Q3 2022 and $522B is currently outstanding, including projects that are announced or under construction. 75% of outstanding investment is in R districts. (fig below from NYT)
Q4 investment numbers are out for the Clean Investment Monitor.
*New this quarter* - we present a breakdown of the past 2.5 years of clean investments mapped to the congressional district boundaries in effect for the 119th Congress.
www.cleaninvestmentmonitor.org/reports/clea...
*New this quarter* - we present a breakdown of the past 2.5 years of clean investments mapped to the congressional district boundaries in effect for the 119th Congress.
www.cleaninvestmentmonitor.org/reports/clea...

Clean Investment Monitor: Q4 2024 Update
In the final quarter of 2024, clean energy and transportation investment in the United States totaled $70 billion, reflecting a slight 1% decline from Q3.
www.cleaninvestmentmonitor.org
February 28, 2025 at 5:04 PM
Q4 investment numbers are out for the Clean Investment Monitor.
*New this quarter* - we present a breakdown of the past 2.5 years of clean investments mapped to the congressional district boundaries in effect for the 119th Congress.
www.cleaninvestmentmonitor.org/reports/clea...
*New this quarter* - we present a breakdown of the past 2.5 years of clean investments mapped to the congressional district boundaries in effect for the 119th Congress.
www.cleaninvestmentmonitor.org/reports/clea...
afternoon hack project: trying to find out when it makes sense to buy vs. rent in an expensive city shouldibuyahouse.streamlit.app

December 23, 2024 at 10:27 PM
afternoon hack project: trying to find out when it makes sense to buy vs. rent in an expensive city shouldibuyahouse.streamlit.app
Reposted by Charlotte McClintock
Hello Bluesky! We're Rhodium Group, an independent research provider with two main areas of expertise: China’s economy and policy dynamics, and global climate change and energy systems.
If you're interested in data-driven research in either of those fields, you'll find it here!
If you're interested in data-driven research in either of those fields, you'll find it here!

About – Rhodium Group
Rhodium Group is an independent research provider with deep expertise in policy and economic analysis. We help decision-makers in both the public and private sectors navigate global challenges through...
rhg.com
November 26, 2024 at 1:48 PM
Hello Bluesky! We're Rhodium Group, an independent research provider with two main areas of expertise: China’s economy and policy dynamics, and global climate change and energy systems.
If you're interested in data-driven research in either of those fields, you'll find it here!
If you're interested in data-driven research in either of those fields, you'll find it here!
New research out today from my team @rhodiumgroup.bsky.social & MIT CEEPR with our Q3 update to the Clean Investment Monitor:
Clean investment is at an all time high in the US, with $71 billion invested in Q3 2024 across manufacturing, energy & industry, and retail segments.
Clean investment is at an all time high in the US, with $71 billion invested in Q3 2024 across manufacturing, energy & industry, and retail segments.

November 21, 2024 at 5:10 PM
New research out today from my team @rhodiumgroup.bsky.social & MIT CEEPR with our Q3 update to the Clean Investment Monitor:
Clean investment is at an all time high in the US, with $71 billion invested in Q3 2024 across manufacturing, energy & industry, and retail segments.
Clean investment is at an all time high in the US, with $71 billion invested in Q3 2024 across manufacturing, energy & industry, and retail segments.
Reposted by Charlotte McClintock

The stickiness of the IRA is a feature, not a bug. More than 3/4 of announced IRA clean energy investment is going to Republican districts. In a close house, it won't take many votes to thwart a repeal of manufacturing tax credits.
November 16, 2024 at 12:12 AM
The stickiness of the IRA is a feature, not a bug. More than 3/4 of announced IRA clean energy investment is going to Republican districts. In a close house, it won't take many votes to thwart a repeal of manufacturing tax credits.
welcome to bluesky @raynamcc.bsky.social!! follow her for all things ocean alkalinity enhancement, coral, and carbon!
November 12, 2024 at 10:43 PM
welcome to bluesky @raynamcc.bsky.social!! follow her for all things ocean alkalinity enhancement, coral, and carbon!
now that everyone's over here, here's a recent report from my team @rhodiumgroup.bsky.social and our partners at Bruegel on solar deployment and manufacturing in the US and Europe 🔌💡

Transatlantic Clean Investment Monitor: A Perspective on Solar PV
This note is the second in a series of quarterly briefings comparing clean technology deployment and manufacturing trends in Europe and the United States as part of a collaboration between Bruegel and...
rhg.com
November 12, 2024 at 10:01 PM
now that everyone's over here, here's a recent report from my team @rhodiumgroup.bsky.social and our partners at Bruegel on solar deployment and manufacturing in the US and Europe 🔌💡
great piece on oil & gas methane from @financialtimes.com

How oil and gas companies disguise their methane emissions
FT analysis shows that firms regularly hide leakages of the deadly greenhouse gas — despite this being one of the easiest climate fixes there is
www.ft.com
November 12, 2024 at 3:50 PM
great piece on oil & gas methane from @financialtimes.com
2000s pop punk is great background music for focused coding - Avril Lavigne getting me through these bugs rn
November 8, 2024 at 8:11 PM
2000s pop punk is great background music for focused coding - Avril Lavigne getting me through these bugs rn
Reposted by Charlotte McClintock

here are my initial thoughts on trump’s win and the future of the clean energy economy.
the focus now shifts to the fight over the inflation reduction act, which is the most important biden climate policy to preserve.
caveat lector, i wrote this at 3am! heatmap.news/politics/don...
the focus now shifts to the fight over the inflation reduction act, which is the most important biden climate policy to preserve.
caveat lector, i wrote this at 3am! heatmap.news/politics/don...

Trump Won. Now the Fight Over the Clean Energy Economy Begins.
What Trump’s victory means for climate policy
heatmap.news
November 6, 2024 at 6:20 PM
here are my initial thoughts on trump’s win and the future of the clean energy economy.
the focus now shifts to the fight over the inflation reduction act, which is the most important biden climate policy to preserve.
caveat lector, i wrote this at 3am! heatmap.news/politics/don...
the focus now shifts to the fight over the inflation reduction act, which is the most important biden climate policy to preserve.
caveat lector, i wrote this at 3am! heatmap.news/politics/don...