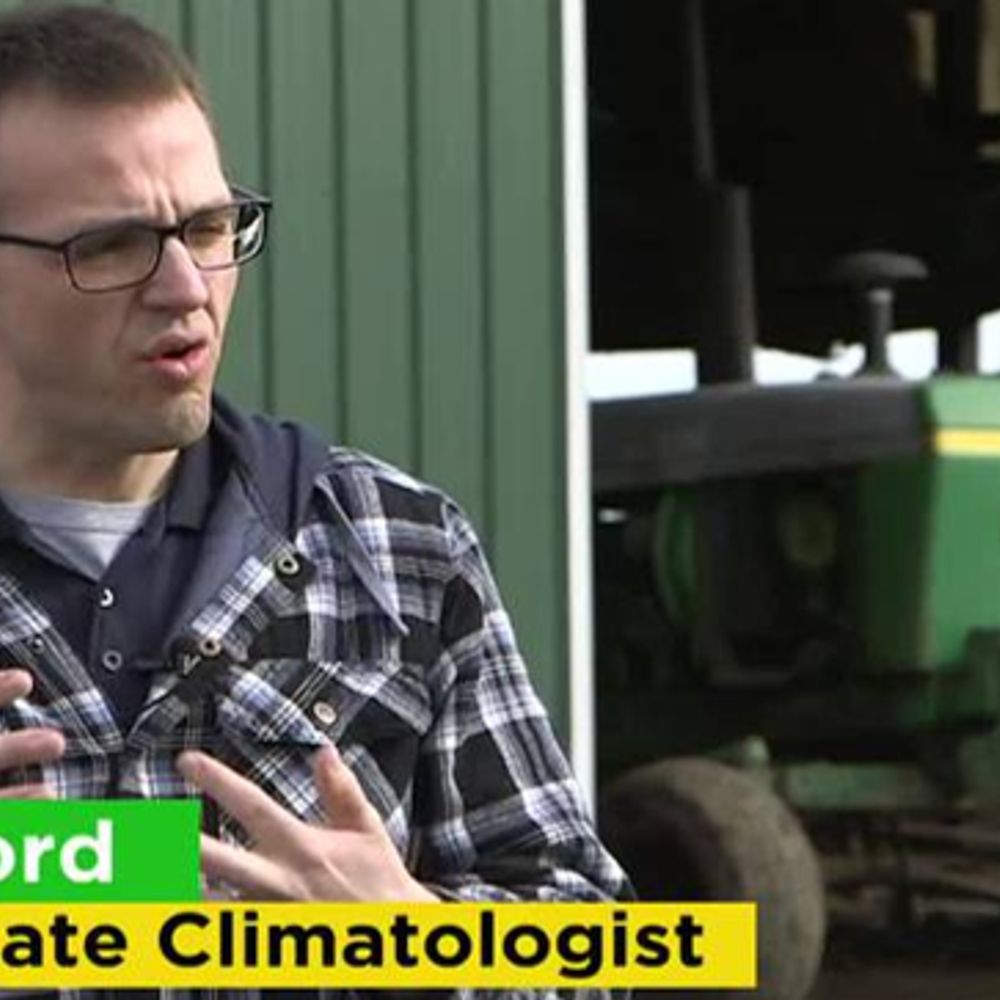
Illinois State Climatologist
@ilclimatologist.bsky.social
700 followers
880 following
20 posts
Official account for the Illinois State Climatologist Office. Based at the Illinois State Water Survey and Prairie Research Institute at the University of Illinois, Urbana-Champaign.
go.illinois.edu/climatologist
Posts
Media
Videos
Starter Packs


Reposted by Illinois State Climatologist
Reposted by Illinois State Climatologist
Reposted by Illinois State Climatologist


Reposted by Illinois State Climatologist


Reposted by Illinois State Climatologist
Matt Lanza
@mattlanza.bsky.social
· Apr 1


Reposted by Illinois State Climatologist