


Krisztina Szűcs
@krisztinaszucs.bsky.social
Data visualization designer
krisztinaszucs.com
krisztinaszucs.com

Reposted by Krisztina Szűcs

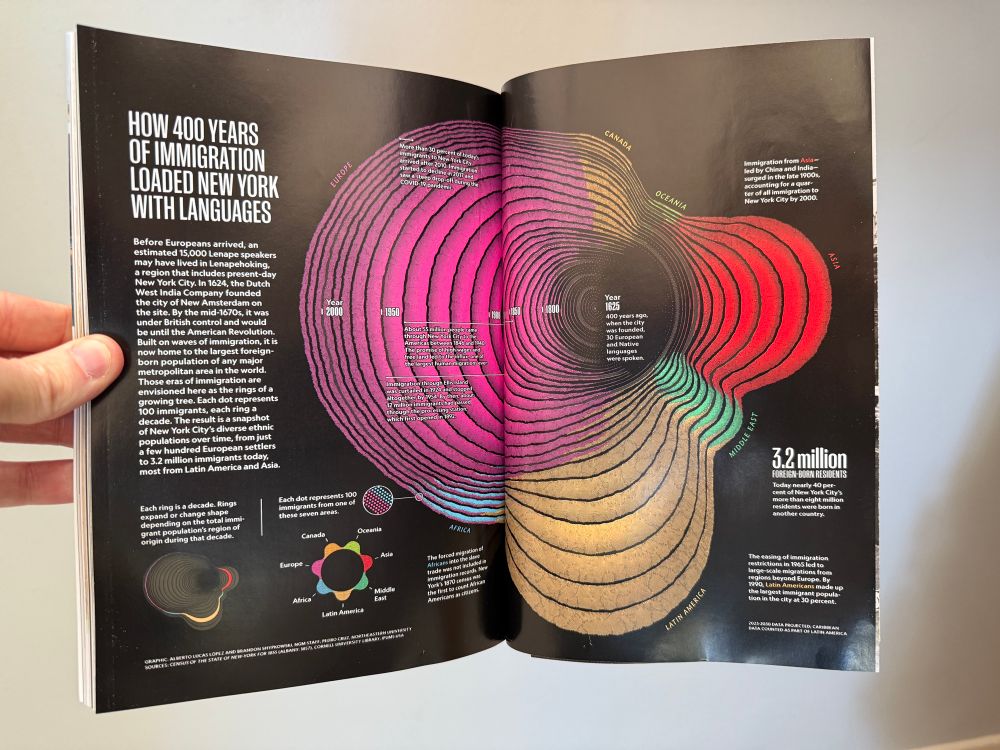
new NatGeo information graphics arrived in the mail

June 23, 2025 at 11:39 PM
new NatGeo information graphics arrived in the mail
Reposted by Krisztina Szűcs

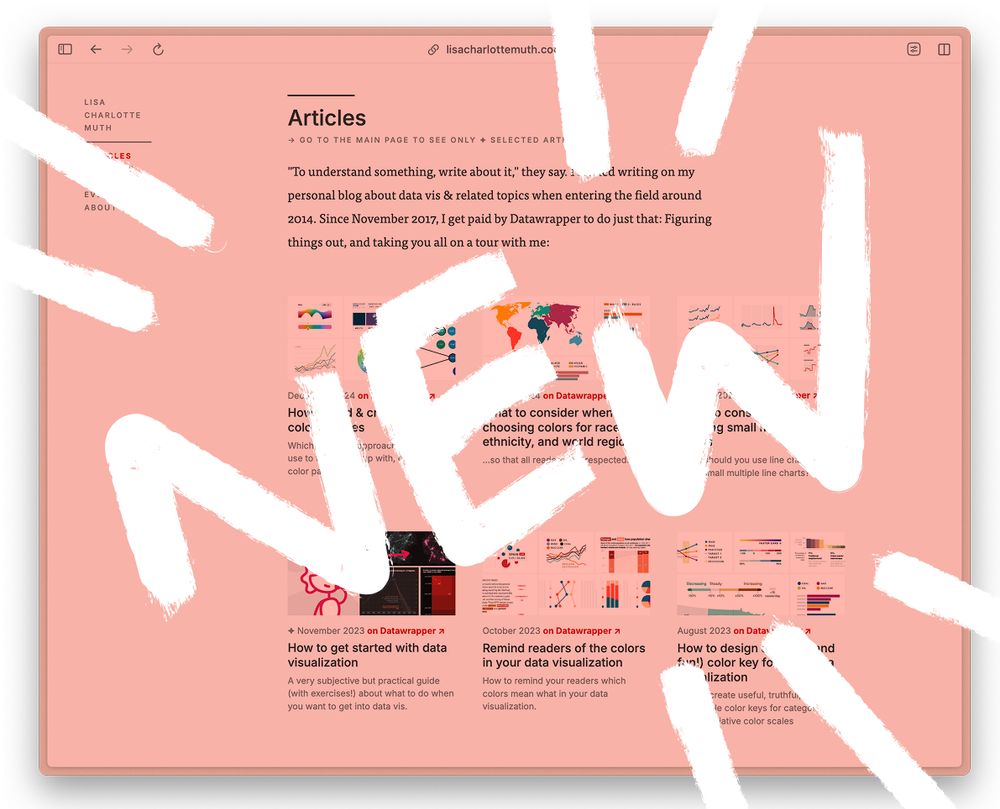
I just added lots of new content to my website! lisacharlottemuth.com
→ #dataviz projects & articles I've worked on at @datawrapper.de in the past years
→ a new "Events" page with information about the Data Vis Meetup, the Data Vis Book Club, and the Unwrapped conference
→ an updated About me page
→ #dataviz projects & articles I've worked on at @datawrapper.de in the past years
→ a new "Events" page with information about the Data Vis Meetup, the Data Vis Book Club, and the Unwrapped conference
→ an updated About me page
May 29, 2025 at 9:35 AM
I just added lots of new content to my website! lisacharlottemuth.com
→ #dataviz projects & articles I've worked on at @datawrapper.de in the past years
→ a new "Events" page with information about the Data Vis Meetup, the Data Vis Book Club, and the Unwrapped conference
→ an updated About me page
→ #dataviz projects & articles I've worked on at @datawrapper.de in the past years
→ a new "Events" page with information about the Data Vis Meetup, the Data Vis Book Club, and the Unwrapped conference
→ an updated About me page
Reposted by Krisztina Szűcs

Minimalistic mapping with isolines 😍 It shows Europe's average maximum temperature in July. The closer the lines are, the more complex the orography, with large temperature changes in small areas, such as mountain regions. Each step between two thermolines is 2ºC.
#dataviz #mapping #rstats
#dataviz #mapping #rstats
May 25, 2025 at 8:43 AM
Reposted by Krisztina Szűcs

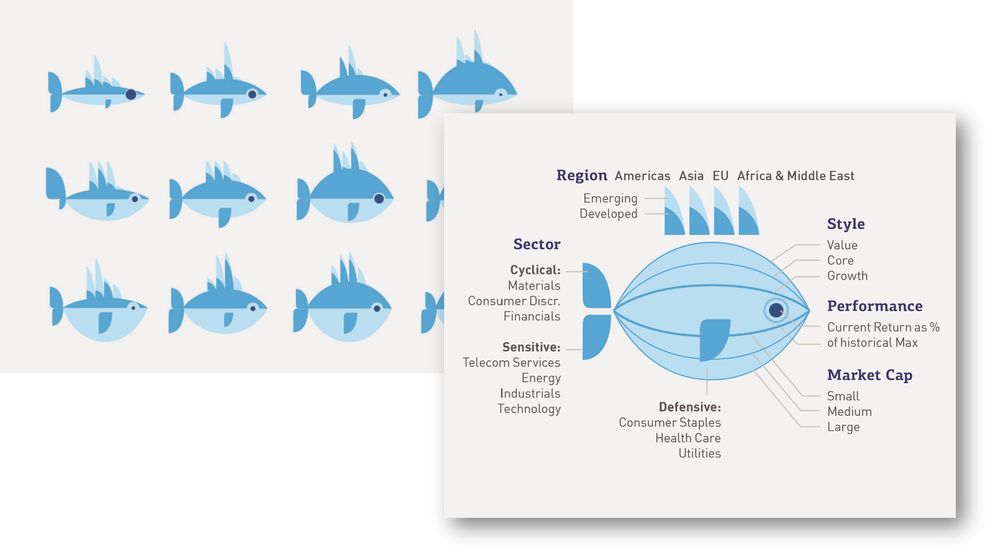
🐟 This is one of the weirder charts in my collection of examples: a set of fish icons to compare funds.
I use it when I talk about visual variables. This chart uses SIZE as a visual variable in 15 different ways, to show 15 different aspects of a fund.
1/4
I use it when I talk about visual variables. This chart uses SIZE as a visual variable in 15 different ways, to show 15 different aspects of a fund.
1/4
May 8, 2025 at 10:33 AM
🐟 This is one of the weirder charts in my collection of examples: a set of fish icons to compare funds.
I use it when I talk about visual variables. This chart uses SIZE as a visual variable in 15 different ways, to show 15 different aspects of a fund.
1/4
I use it when I talk about visual variables. This chart uses SIZE as a visual variable in 15 different ways, to show 15 different aspects of a fund.
1/4
Reposted by Krisztina Szűcs

My colleagues at NYT came to my desk with cameras to make these videos. I'm so grateful to work in a place like this, doing what I love.
April 21, 2025 at 8:19 PM
My colleagues at NYT came to my desk with cameras to make these videos. I'm so grateful to work in a place like this, doing what I love.
Reposted by Krisztina Szűcs

the roads of DC, colored by the closest metro line!
using road/station data from Open Data DC and rendered with @threejs.org
#maps #washingtondc #threejs
using road/station data from Open Data DC and rendered with @threejs.org
#maps #washingtondc #threejs
April 14, 2025 at 3:36 PM
the roads of DC, colored by the closest metro line!
using road/station data from Open Data DC and rendered with @threejs.org
#maps #washingtondc #threejs
using road/station data from Open Data DC and rendered with @threejs.org
#maps #washingtondc #threejs
Reposted by Krisztina Szűcs

random slides from my lecture yesterday, titled ‘Intuitive Thinking and Computational Space.’


April 10, 2025 at 6:05 PM
random slides from my lecture yesterday, titled ‘Intuitive Thinking and Computational Space.’
Reposted by Krisztina Szűcs

Might make some tweaks later once I start on the UI elements, and the suit locations will be randomized during the game, but we now have a level map for this project.
Shoutout to @watabou.bsky.social and their awesome generators.
#gamedev #indiegames #indiegamedev
Shoutout to @watabou.bsky.social and their awesome generators.
#gamedev #indiegames #indiegamedev

April 8, 2025 at 7:34 AM
Might make some tweaks later once I start on the UI elements, and the suit locations will be randomized during the game, but we now have a level map for this project.
Shoutout to @watabou.bsky.social and their awesome generators.
#gamedev #indiegames #indiegamedev
Shoutout to @watabou.bsky.social and their awesome generators.
#gamedev #indiegames #indiegamedev
Reposted by Krisztina Szűcs

The Catropolis metro. A subway system unlike any other: Every stop is a #cat breed, every line a separate family of felines. A unique and fun map to adorn your cat lover's home 😻 www.studiolegenda.com/produ... 🔹

Catropolis Metro
The official Catropolis Metro map, the only one of its kind. This English-language, B2-poster (50x70cm - 19.6x27.5in) contains every cat species and breed that exists (and once existed), together with many feline word jokes, references and a whole bu
www.studiolegenda.com
April 6, 2025 at 5:30 PM
The Catropolis metro. A subway system unlike any other: Every stop is a #cat breed, every line a separate family of felines. A unique and fun map to adorn your cat lover's home 😻 www.studiolegenda.com/produ... 🔹
Reposted by Krisztina Szűcs

My love letter to the genre of speculative evolution, The Practical Guide for the Amateur Exonaturalist, is available now on DriveThruRPG! Envision alien biospheres and their incredible denizens through creative prompts and exercises.
www.drivethrurpg.com/en/product/5...
www.drivethrurpg.com/en/product/5...

March 23, 2025 at 2:09 PM
My love letter to the genre of speculative evolution, The Practical Guide for the Amateur Exonaturalist, is available now on DriveThruRPG! Envision alien biospheres and their incredible denizens through creative prompts and exercises.
www.drivethrurpg.com/en/product/5...
www.drivethrurpg.com/en/product/5...
Reposted by Krisztina Szűcs

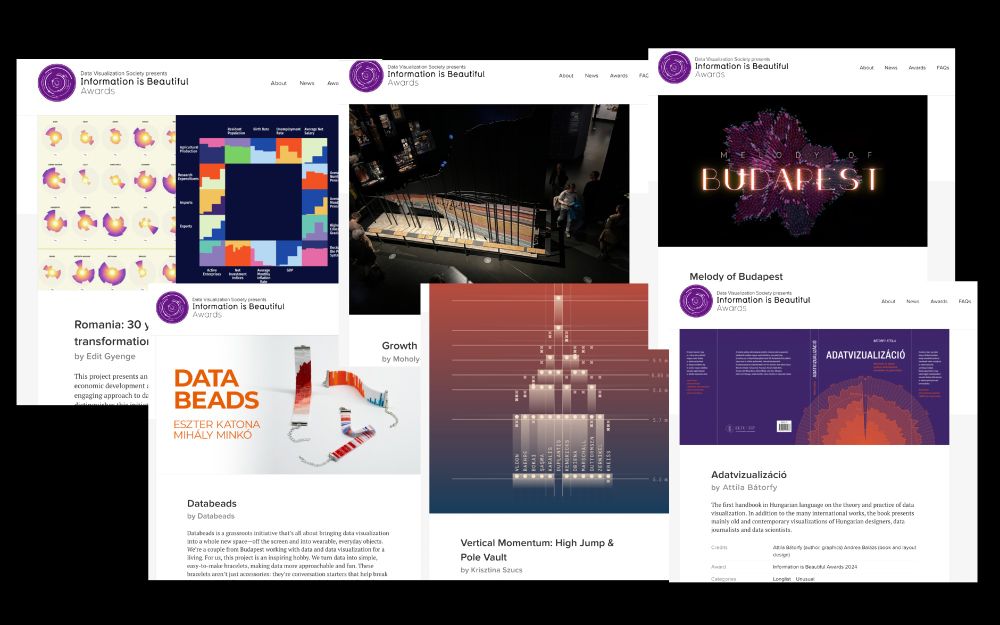
Many Hungarian works are longlisted for the Information is Beautiful Award this year. @krisztinaszucs.bsky.social @editgyenge.bsky.social Milán Janosov, Misi Minkó and Eszter Katona, Melinda Sipos and Mátyás Fusz. And my book. www.informationisbeautifulawards.com/showcase?aca...
March 11, 2025 at 3:06 PM
Many Hungarian works are longlisted for the Information is Beautiful Award this year. @krisztinaszucs.bsky.social @editgyenge.bsky.social Milán Janosov, Misi Minkó and Eszter Katona, Melinda Sipos and Mátyás Fusz. And my book. www.informationisbeautifulawards.com/showcase?aca...
Reposted by Krisztina Szűcs

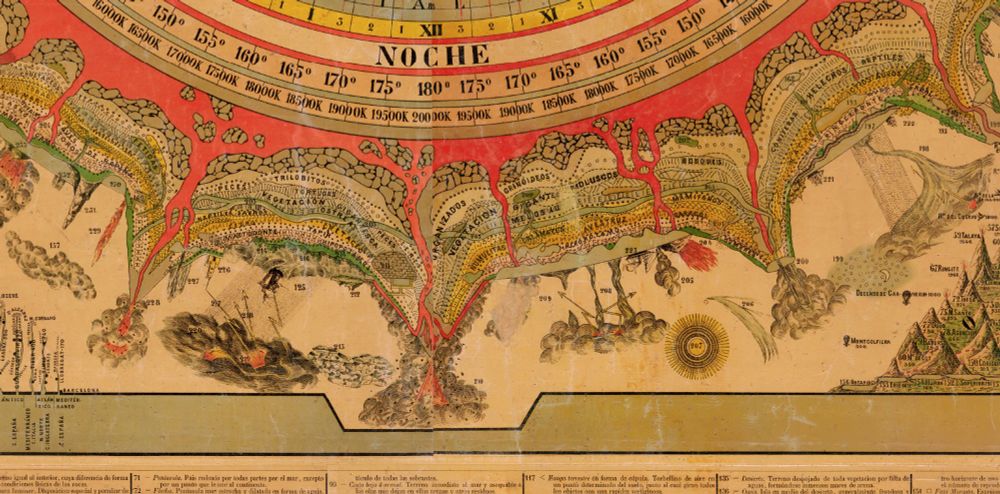
I defy you not to be entranced by this super awesome Mexican map centered around the COSMOGRAPHIC CLOCK!
www.davidrumsey.com/luna/servlet...
www.davidrumsey.com/luna/servlet...


March 9, 2025 at 10:14 PM
I defy you not to be entranced by this super awesome Mexican map centered around the COSMOGRAPHIC CLOCK!
www.davidrumsey.com/luna/servlet...
www.davidrumsey.com/luna/servlet...
Reposted by Krisztina Szűcs

It's been a _very_ long time, but I finally wrote an extensive full dataviz design creation blog post again! 🙌
You can read about all the ups and downs, what worked, when it spectacularly failed, of trying to create the GitHub Top Contributor Network here: www.visualcinnamon.com/2025/01/gith...
You can read about all the ups and downs, what worked, when it spectacularly failed, of trying to create the GitHub Top Contributor Network here: www.visualcinnamon.com/2025/01/gith...

Visualizing the Top Contributor Network of Any GitHub Repo
Revealing the design process of this elaborate network visualization of top contributors to any GitHub repository
www.visualcinnamon.com
February 27, 2025 at 9:30 AM
It's been a _very_ long time, but I finally wrote an extensive full dataviz design creation blog post again! 🙌
You can read about all the ups and downs, what worked, when it spectacularly failed, of trying to create the GitHub Top Contributor Network here: www.visualcinnamon.com/2025/01/gith...
You can read about all the ups and downs, what worked, when it spectacularly failed, of trying to create the GitHub Top Contributor Network here: www.visualcinnamon.com/2025/01/gith...
Reposted by Krisztina Szűcs

Blessings upon city and county GIS offices that make road and sidewalk polygons available, so that I can calculate just how much of a city has been sacrificed to the almighty automobile. (Looks like about 8% of Cincinnati.)

January 6, 2025 at 7:08 PM
Blessings upon city and county GIS offices that make road and sidewalk polygons available, so that I can calculate just how much of a city has been sacrificed to the almighty automobile. (Looks like about 8% of Cincinnati.)
Reposted by Krisztina Szűcs

NEW: The How We Made It part of our Climate Graphic: Explained weekly newsletter is now available online. Find out what goes into making the Climate Graphic of the Week
on.ft.com/41v6YD9
on.ft.com/41v6YD9
February 25, 2025 at 6:24 PM
NEW: The How We Made It part of our Climate Graphic: Explained weekly newsletter is now available online. Find out what goes into making the Climate Graphic of the Week
on.ft.com/41v6YD9
on.ft.com/41v6YD9
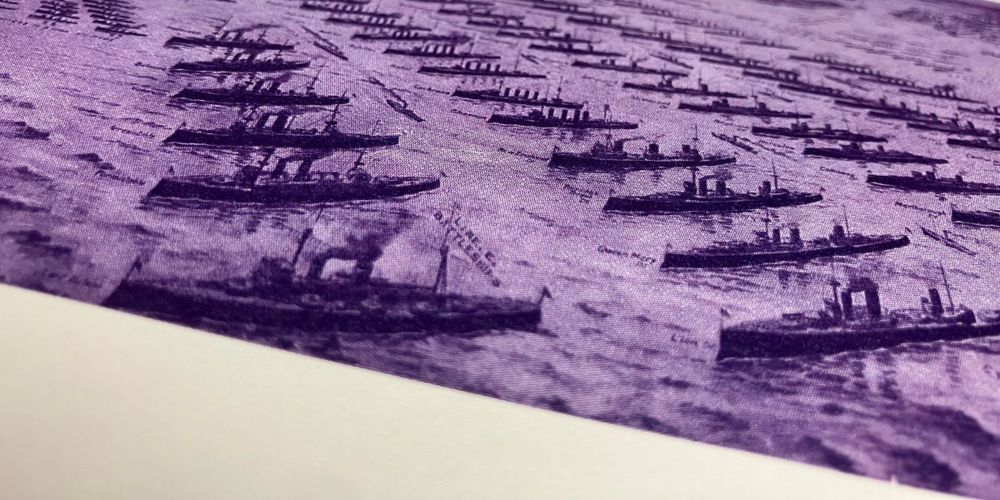
Reposted by Krisztina Szűcs

This is the sort of cartography modern tools cant *really* do well, simply because there is no antidote to a staggering amount of labor here:

February 26, 2025 at 2:56 AM
This is the sort of cartography modern tools cant *really* do well, simply because there is no antidote to a staggering amount of labor here:
Reposted by Krisztina Szűcs

This new Data Vis Dispatch is full of maps – and we love maps. But it also includes annotated lyrics, multiple lines, bracelets (yes!), and complex interactive visualizations.
See them on our blog: https://blog.datawrapper.de/data-vis-dispatch-february-11-2025/
See them on our blog: https://blog.datawrapper.de/data-vis-dispatch-february-11-2025/


February 11, 2025 at 2:37 PM
This new Data Vis Dispatch is full of maps – and we love maps. But it also includes annotated lyrics, multiple lines, bracelets (yes!), and complex interactive visualizations.
See them on our blog: https://blog.datawrapper.de/data-vis-dispatch-february-11-2025/
See them on our blog: https://blog.datawrapper.de/data-vis-dispatch-february-11-2025/
Reposted by Krisztina Szűcs
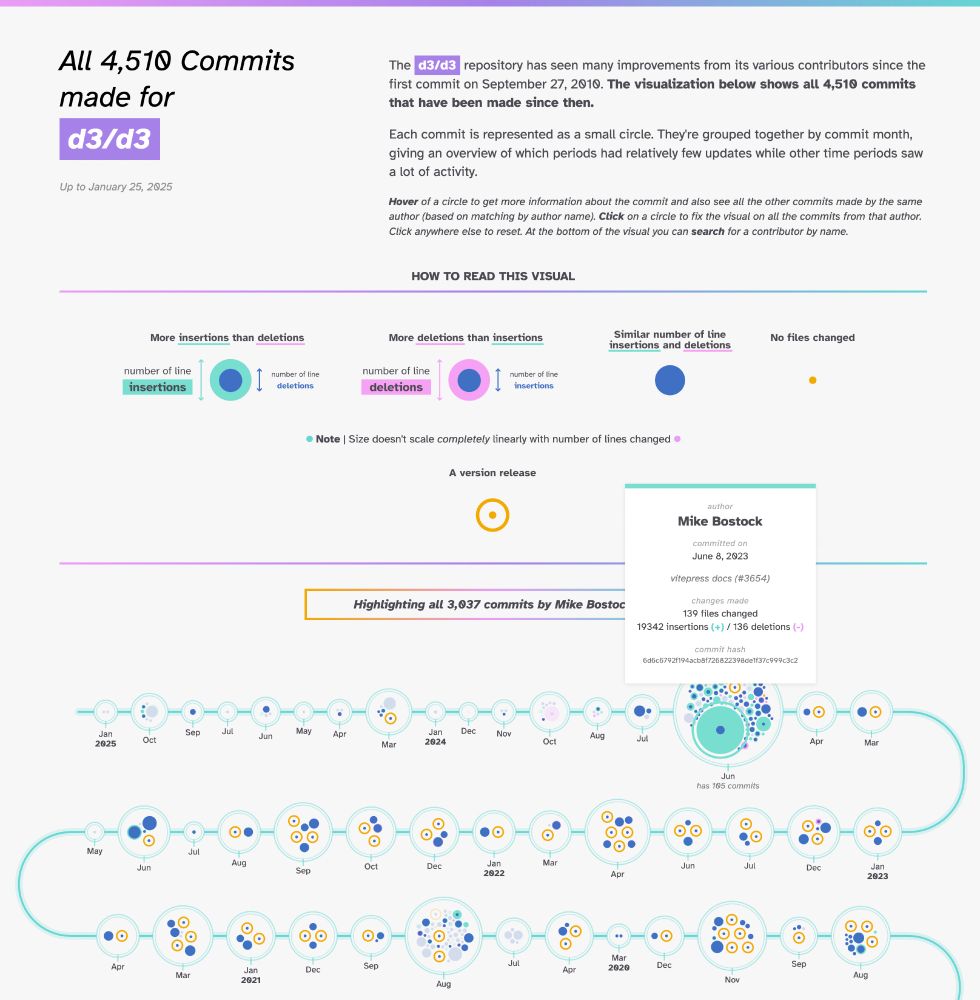
My latest project lets you explore the entire commit history of any GitHub repo ✨
Obviously, D3.js was one of the 1st repos I tested. You can clearly see the 3000+ commits made by its creator @ocks.org! But also @fil.rezo.net & many others.
nbremer.github.io/ORCA/commit-...
Obviously, D3.js was one of the 1st repos I tested. You can clearly see the 3000+ commits made by its creator @ocks.org! But also @fil.rezo.net & many others.
nbremer.github.io/ORCA/commit-...
January 28, 2025 at 2:53 PM
My latest project lets you explore the entire commit history of any GitHub repo ✨
Obviously, D3.js was one of the 1st repos I tested. You can clearly see the 3000+ commits made by its creator @ocks.org! But also @fil.rezo.net & many others.
nbremer.github.io/ORCA/commit-...
Obviously, D3.js was one of the 1st repos I tested. You can clearly see the 3000+ commits made by its creator @ocks.org! But also @fil.rezo.net & many others.
nbremer.github.io/ORCA/commit-...
Reposted by Krisztina Szűcs

Nice looking graph from @financialtimes.com: “Never ever make predictions”
Implied rates forecasts over time, and what rates have actually done:
Implied rates forecasts over time, and what rates have actually done:

December 28, 2024 at 3:42 PM
Nice looking graph from @financialtimes.com: “Never ever make predictions”
Implied rates forecasts over time, and what rates have actually done:
Implied rates forecasts over time, and what rates have actually done:
Reposted by Krisztina Szűcs
My first post on Substack. That was my year 2024.
2024
Dataviz projects, my first book, academic work
attilabatorfy.substack.com
January 1, 2025 at 1:10 PM
My first post on Substack. That was my year 2024.
Reposted by Krisztina Szűcs
The glasses are clinking, the countdown is running, but you’re still thinking about data visualizations? We got you covered with our list of lists of 2024 data vis.
Check out personal favorites, portfolios, and award-winning vis from 2024 blog.datawrapper.de/data-vis-dispatch-december-31-2024/
Check out personal favorites, portfolios, and award-winning vis from 2024 blog.datawrapper.de/data-vis-dispatch-december-31-2024/

December 31, 2024 at 5:00 PM
The glasses are clinking, the countdown is running, but you’re still thinking about data visualizations? We got you covered with our list of lists of 2024 data vis.
Check out personal favorites, portfolios, and award-winning vis from 2024 blog.datawrapper.de/data-vis-dispatch-december-31-2024/
Check out personal favorites, portfolios, and award-winning vis from 2024 blog.datawrapper.de/data-vis-dispatch-december-31-2024/
How to create data visualization by making a few tweaks to a perfectly fine table:
krisztinaszucs.com/blog/2024121...
#dataviz

Revisiting High Jump and Pole Vault Visualizations: Small Changes, Big Impact
During the Paris Olympics 2024, I created four animated visualizations of the high jump and pole vault finals.
Here's a simple walkthrough of the process, showing how small tweaks to a well-known da...
krisztinaszucs.com
December 28, 2024 at 2:49 PM
How to create data visualization by making a few tweaks to a perfectly fine table:
krisztinaszucs.com/blog/2024121...
#dataviz
The Winter Solstice occurs today. This is the longest night and shortest day of the year.
If you're in Budapest, you can find my "How long are the nights" prints at Ajándék Terminál (in Mammut 2) until Dec 24.
Full project ➡ plotparade.com/gallery_sunr...
#WinterSolstice #dataviz
If you're in Budapest, you can find my "How long are the nights" prints at Ajándék Terminál (in Mammut 2) until Dec 24.
Full project ➡ plotparade.com/gallery_sunr...
#WinterSolstice #dataviz


December 21, 2024 at 2:00 PM
The Winter Solstice occurs today. This is the longest night and shortest day of the year.
If you're in Budapest, you can find my "How long are the nights" prints at Ajándék Terminál (in Mammut 2) until Dec 24.
Full project ➡ plotparade.com/gallery_sunr...
#WinterSolstice #dataviz
If you're in Budapest, you can find my "How long are the nights" prints at Ajándék Terminál (in Mammut 2) until Dec 24.
Full project ➡ plotparade.com/gallery_sunr...
#WinterSolstice #dataviz
Reposted by Krisztina Szűcs
End of the year! ✨🎄🎇 So here we've got a special Data Vis Dispatch for you: it comes from the whole Datawrapper team. We're sharing our favorite visualizations of 2024. Take a look here 🎁 https://blog.datawrapper.de/data-vis-dispatch-december-17-2024/ and tell us: what were your favorites?

December 17, 2024 at 4:33 PM
End of the year! ✨🎄🎇 So here we've got a special Data Vis Dispatch for you: it comes from the whole Datawrapper team. We're sharing our favorite visualizations of 2024. Take a look here 🎁 https://blog.datawrapper.de/data-vis-dispatch-december-17-2024/ and tell us: what were your favorites?