


Kyle Butts
@kylefbutts.bsky.social
TIL you can calculate the mean and the variance in one pass through a vector 🤯
Really nice article showing how:
nullbuffer.com/articles/wel...
Really nice article showing how:
nullbuffer.com/articles/wel...
Numerically stable algorithm for computing the running mean
nullbuffer.com
September 30, 2025 at 1:53 PM
TIL you can calculate the mean and the variance in one pass through a vector 🤯
Really nice article showing how:
nullbuffer.com/articles/wel...
Really nice article showing how:
nullbuffer.com/articles/wel...
Come be a razorback! We are hiring two positions this year at the U of Arkansas!
Macro/General Equilibrium: www.aeaweb.org/joe/listing....
Applied Micro: www.aeaweb.org/joe/listing....
Northwest Arkansas is consistently ranked one of the best places to live. Here's some highlights!
Macro/General Equilibrium: www.aeaweb.org/joe/listing....
Applied Micro: www.aeaweb.org/joe/listing....
Northwest Arkansas is consistently ranked one of the best places to live. Here's some highlights!

September 23, 2025 at 2:45 PM
Come be a razorback! We are hiring two positions this year at the U of Arkansas!
Macro/General Equilibrium: www.aeaweb.org/joe/listing....
Applied Micro: www.aeaweb.org/joe/listing....
Northwest Arkansas is consistently ranked one of the best places to live. Here's some highlights!
Macro/General Equilibrium: www.aeaweb.org/joe/listing....
Applied Micro: www.aeaweb.org/joe/listing....
Northwest Arkansas is consistently ranked one of the best places to live. Here's some highlights!
Does anyone have really good examples of a github repository for a research paper. Trying to get good examples for a lesson I'm giving
June 9, 2025 at 4:24 PM
Does anyone have really good examples of a github repository for a research paper. Trying to get good examples for a lesson I'm giving
github.com/kylebutts/vs...
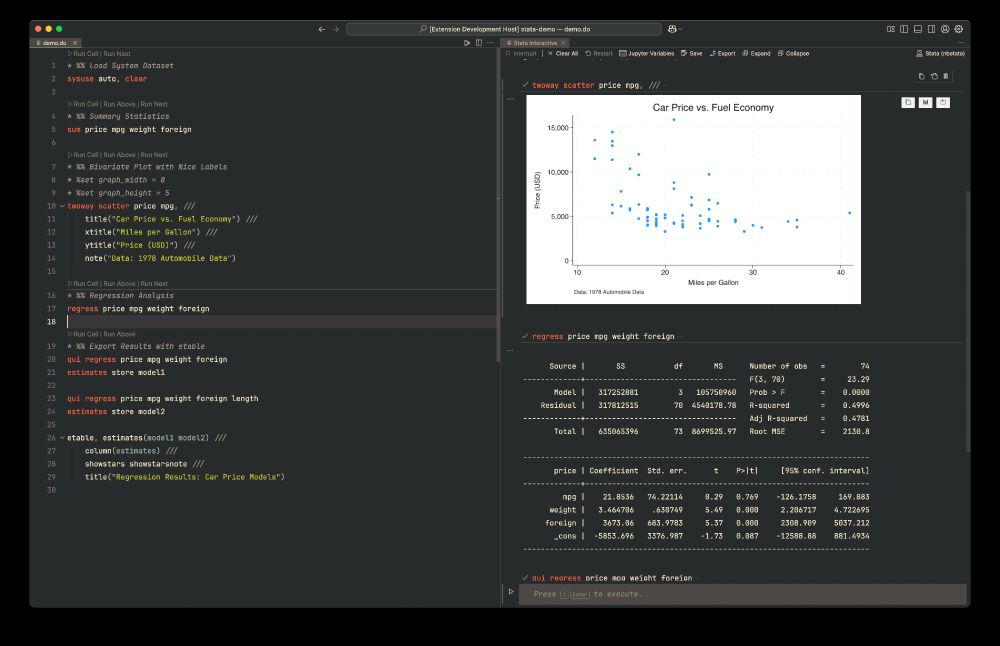
If you are using vscode and stata, you should try out my extension. It uses interactive window which let's you write in a `.do` file but get a notebook type experience.
If you are using vscode and stata, you should try out my extension. It uses interactive window which let's you write in a `.do` file but get a notebook type experience.
June 8, 2025 at 3:07 PM
github.com/kylebutts/vs...
If you are using vscode and stata, you should try out my extension. It uses interactive window which let's you write in a `.do` file but get a notebook type experience.
If you are using vscode and stata, you should try out my extension. It uses interactive window which let's you write in a `.do` file but get a notebook type experience.
The answer is all 0s !!! what a frustrating choice !!!!
Stata quiz. what do you think the output of `tab` will be?
```
sysuse auto, replace
reg mpg i.rep78 if rep78 == 2, nocons
predict xb
tab xb if rep78 != 2
```
```
sysuse auto, replace
reg mpg i.rep78 if rep78 == 2, nocons
predict xb
tab xb if rep78 != 2
```
April 28, 2025 at 4:51 PM
The answer is all 0s !!! what a frustrating choice !!!!
Stata quiz. what do you think the output of `tab` will be?
```
sysuse auto, replace
reg mpg i.rep78 if rep78 == 2, nocons
predict xb
tab xb if rep78 != 2
```
```
sysuse auto, replace
reg mpg i.rep78 if rep78 == 2, nocons
predict xb
tab xb if rep78 != 2
```
April 23, 2025 at 5:01 PM
Stata quiz. what do you think the output of `tab` will be?
```
sysuse auto, replace
reg mpg i.rep78 if rep78 == 2, nocons
predict xb
tab xb if rep78 != 2
```
```
sysuse auto, replace
reg mpg i.rep78 if rep78 == 2, nocons
predict xb
tab xb if rep78 != 2
```
kylebutts.com/blog/2025-04...
A short blog post for efficient stats coding. All about the importance of dimensionality when doing matrix operations ft. 100x speed-up of my code
A short blog post for efficient stats coding. All about the importance of dimensionality when doing matrix operations ft. 100x speed-up of my code
Kyle Butts
Kyle Butts -- Urban Economics and Applied Econometrics
kylebutts.com
April 19, 2025 at 2:06 AM
kylebutts.com/blog/2025-04...
A short blog post for efficient stats coding. All about the importance of dimensionality when doing matrix operations ft. 100x speed-up of my code
A short blog post for efficient stats coding. All about the importance of dimensionality when doing matrix operations ft. 100x speed-up of my code
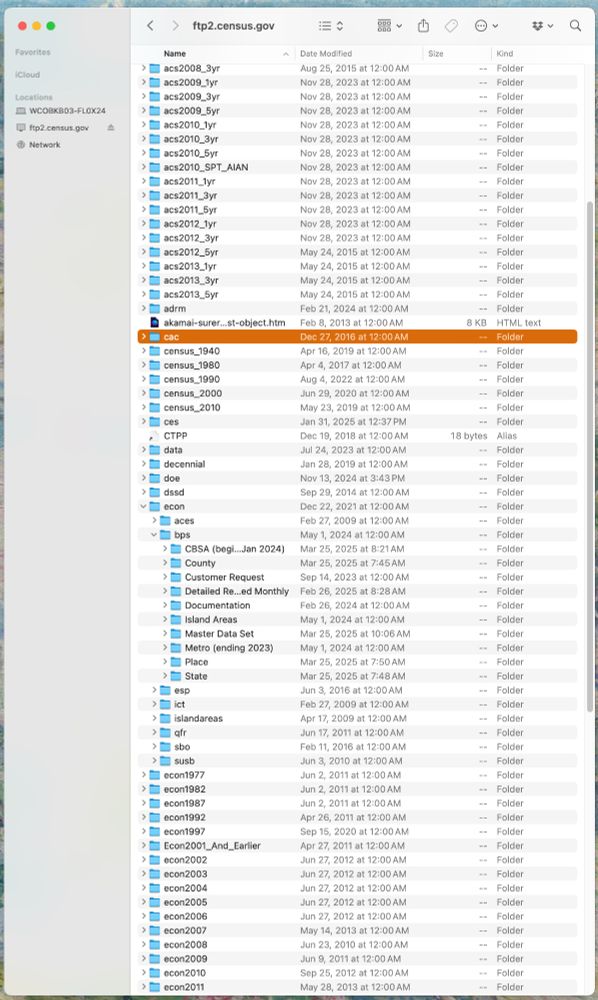
TIL how to download census data (www2.census.gov) super simply.
Finder: Go > Connect to Server > ftp://ftp2.census.gov/. Login as guest and 🤯
Finder: Go > Connect to Server > ftp://ftp2.census.gov/. Login as guest and 🤯
April 5, 2025 at 1:48 PM
TIL how to download census data (www2.census.gov) super simply.
Finder: Go > Connect to Server > ftp://ftp2.census.gov/. Login as guest and 🤯
Finder: Go > Connect to Server > ftp://ftp2.census.gov/. Login as guest and 🤯
great little explanation on why to avoid passive voice refactoringenglish.com/chapters/pas...
Passive Voice Considered Harmful
Effective writing for software developers
refactoringenglish.com
March 25, 2025 at 12:34 PM
great little explanation on why to avoid passive voice refactoringenglish.com/chapters/pas...
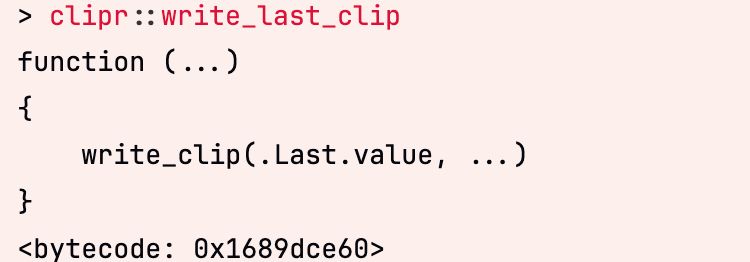
R tip: If you run code but forget to save it in a variable, you can use `.Last.value` in the console.
More, if you want to copy the result to your clipboard, use `clipr::write_last_clip`:
More, if you want to copy the result to your clipboard, use `clipr::write_last_clip`:
March 11, 2025 at 9:52 PM
R tip: If you run code but forget to save it in a variable, you can use `.Last.value` in the console.
More, if you want to copy the result to your clipboard, use `clipr::write_last_clip`:
More, if you want to copy the result to your clipboard, use `clipr::write_last_clip`:
Reposted by Kyle Butts

🚨 The "penguins" data is coming to the base #rstats{datasets} in 4.5.0!
@ellakaye.co.uk & @HeathrTurnr.fosstodon.org.ap.brid.gy r prepared an adapted and a raw version of the data set based on the {palmerpenguins} 📦 by @allisonhorst.bsky.social @apreshill.com and Kristen Gorman.
📈 Scatter plot:
@ellakaye.co.uk & @HeathrTurnr.fosstodon.org.ap.brid.gy r prepared an adapted and a raw version of the data set based on the {palmerpenguins} 📦 by @allisonhorst.bsky.social @apreshill.com and Kristen Gorman.
📈 Scatter plot:
![Scatter plot of bill depth vs. length by species (color) and sex (symbol). It shows positive correlations for all species with males tending to have bigger bills than females.
sym <- c(1, 16)
pal <- c("darkorange","purple","cyan4")
plot(bill_dep ~ bill_len, data = penguins, pch = sym[sex], col = pal[species])](https://cdn.bsky.app/img/feed_thumbnail/plain/did:plc:finqjjlz4s2gkjovjemkssdy/bafkreia5vg7eev5b7g2cz3wv63gucwutk5w4hpbeizu24cm2vwfykmppti@jpeg)
February 24, 2025 at 1:48 PM
🚨 The "penguins" data is coming to the base #rstats{datasets} in 4.5.0!
@ellakaye.co.uk & @HeathrTurnr.fosstodon.org.ap.brid.gy r prepared an adapted and a raw version of the data set based on the {palmerpenguins} 📦 by @allisonhorst.bsky.social @apreshill.com and Kristen Gorman.
📈 Scatter plot:
@ellakaye.co.uk & @HeathrTurnr.fosstodon.org.ap.brid.gy r prepared an adapted and a raw version of the data set based on the {palmerpenguins} 📦 by @allisonhorst.bsky.social @apreshill.com and Kristen Gorman.
📈 Scatter plot:
snow day in Fayetteville
February 20, 2025 at 3:53 PM
snow day in Fayetteville
Quick tip:
If you store a pdf on GitHub, like this:
github.com/kylebutts/Ge...
You can make an easy to view link by replacing `github.com/` with `nbviewer.org/github/` and it looks like this: nbviewer.org/github/kyleb...
If you store a pdf on GitHub, like this:
github.com/kylebutts/Ge...
You can make an easy to view link by replacing `github.com/` with `nbviewer.org/github/` and it looks like this: nbviewer.org/github/kyleb...
github.com
January 17, 2025 at 5:22 PM
Quick tip:
If you store a pdf on GitHub, like this:
github.com/kylebutts/Ge...
You can make an easy to view link by replacing `github.com/` with `nbviewer.org/github/` and it looks like this: nbviewer.org/github/kyleb...
If you store a pdf on GitHub, like this:
github.com/kylebutts/Ge...
You can make an easy to view link by replacing `github.com/` with `nbviewer.org/github/` and it looks like this: nbviewer.org/github/kyleb...
Reposted by Kyle Butts

You can tell companies’ AI projects are going really well because every app is bait-and-switching their most commonly pressed button with something called like “Answers By Glorp” to get people to even accidentally use it
January 3, 2025 at 6:25 AM
You can tell companies’ AI projects are going really well because every app is bait-and-switching their most commonly pressed button with something called like “Answers By Glorp” to get people to even accidentally use it
judge: “so you said the true vote share is in this interval 95% of the time? how could that be true if the true vote share is not in that interval”

Donald Trump is suing the Iowa paper because he’s still mad about an election poll he didn’t like. The paper isn’t standing for it.

Des Moines Register Responds to Trump’s Deranged Lawsuit
Donald Trump is suing the Iowa paper because he’s still mad about an election poll he didn’t like. The paper isn’t standing for it.
newrepublic.com
December 18, 2024 at 4:07 PM
judge: “so you said the true vote share is in this interval 95% of the time? how could that be true if the true vote share is not in that interval”
Working on a new R package. Looking for applications that do two things:
1. DID with y to show an effect
2. DID with X to show a possible “mechanism” of why treatment changed y
This could be a published paper or a paper you're working on (that I might help make "fancier" / cooler !!)
1. DID with y to show an effect
2. DID with X to show a possible “mechanism” of why treatment changed y
This could be a published paper or a paper you're working on (that I might help make "fancier" / cooler !!)
December 17, 2024 at 6:28 PM
Working on a new R package. Looking for applications that do two things:
1. DID with y to show an effect
2. DID with X to show a possible “mechanism” of why treatment changed y
This could be a published paper or a paper you're working on (that I might help make "fancier" / cooler !!)
1. DID with y to show an effect
2. DID with X to show a possible “mechanism” of why treatment changed y
This could be a published paper or a paper you're working on (that I might help make "fancier" / cooler !!)
Is there a better sign of AI hype than MICROSOFT creating a package to convert docx/pptx -> md USING CHAT GPT ????https://github.com/microsoft/markitdown
December 15, 2024 at 4:05 PM
Is there a better sign of AI hype than MICROSOFT creating a package to convert docx/pptx -> md USING CHAT GPT ????https://github.com/microsoft/markitdown
never felt so seen
December 13, 2024 at 11:38 AM
never felt so seen
Now would be a great time for overleaf users (my coauthors) to delete their account and stop making me use the bad web app
December 3, 2024 at 5:28 PM
Now would be a great time for overleaf users (my coauthors) to delete their account and stop making me use the bad web app
Reposted by Kyle Butts

The Environmental Inequality Lab is hiring 2 new pre-docs to join our team! We do research in environmental economics but those with interests in labor/public/urban/spatial/development economics should def apply. Apply here: tinyurl.com/EIL-pre-doc
@AereOrg
@AereOrg

Pre-Doctoral Fellow, Department of Economics and Frank Batten School of Leadership & Public Policy in Charlottesville, Virginia, United States of America | Research at University of Virginia
Apply for Pre-Doctoral Fellow, Department of Economics and Frank Batten School of Leadership & Public Policy job with University of Virginia in Charlottesville, Virginia, United States of America. Res...
tinyurl.com
November 22, 2024 at 2:38 PM
The Environmental Inequality Lab is hiring 2 new pre-docs to join our team! We do research in environmental economics but those with interests in labor/public/urban/spatial/development economics should def apply. Apply here: tinyurl.com/EIL-pre-doc
@AereOrg
@AereOrg
Working on my applied metrics course; Here are my figures using Ashenfelter's dip (1978 paper)

November 11, 2024 at 3:17 PM
Working on my applied metrics course; Here are my figures using Ashenfelter's dip (1978 paper)
In Judge FE style settings, how many observations are usually available per judge? Is there ever settings with few number of observations?
February 16, 2024 at 3:41 PM
In Judge FE style settings, how many observations are usually available per judge? Is there ever settings with few number of observations?
Been formalizing a lot of my workflow into R packages. Today, I have added `tikzsave` to `kfbmisc` package for making figures:
ggplot() -> tikzpicture -> pre-compiled into pdf (using latex themes)
gist.github.com/kylebutts/9c...
ggplot() -> tikzpicture -> pre-compiled into pdf (using latex themes)
gist.github.com/kylebutts/9c...

January 24, 2024 at 4:56 PM
Been formalizing a lot of my workflow into R packages. Today, I have added `tikzsave` to `kfbmisc` package for making figures:
ggplot() -> tikzpicture -> pre-compiled into pdf (using latex themes)
gist.github.com/kylebutts/9c...
ggplot() -> tikzpicture -> pre-compiled into pdf (using latex themes)
gist.github.com/kylebutts/9c...
Metrics question: I have a simple regression:
y_i = \beta x_i + u_i
y_i is an estimated quantity from a survey and I have the standard error on that estimate. What's the "correct" way to upweight observations with small standard errors?
y_i = \beta x_i + u_i
y_i is an estimated quantity from a survey and I have the standard error on that estimate. What's the "correct" way to upweight observations with small standard errors?
December 18, 2023 at 3:33 PM
Metrics question: I have a simple regression:
y_i = \beta x_i + u_i
y_i is an estimated quantity from a survey and I have the standard error on that estimate. What's the "correct" way to upweight observations with small standard errors?
y_i = \beta x_i + u_i
y_i is an estimated quantity from a survey and I have the standard error on that estimate. What's the "correct" way to upweight observations with small standard errors?