Molly Clark
@mollyaclark.bsky.social
200 followers 360 following 25 posts
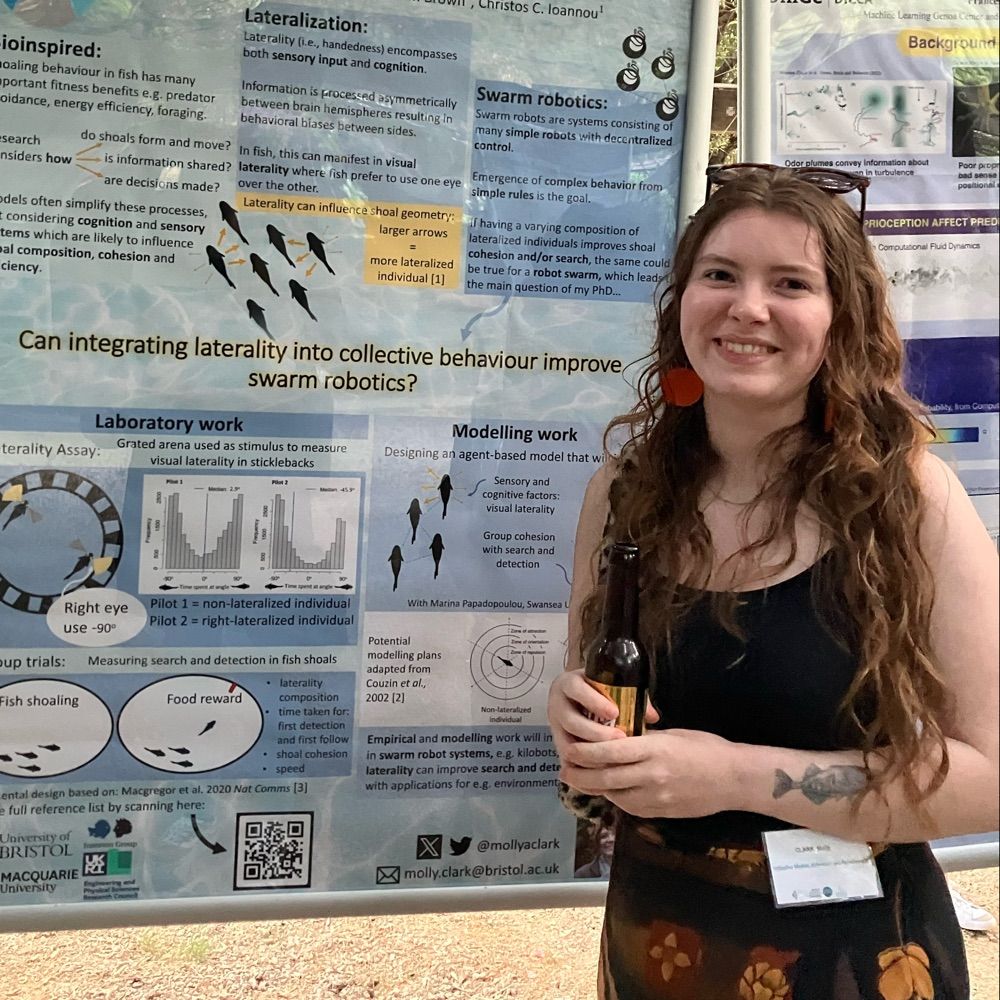
Behavioural ecologist in training🐟🤖PhD at Bristol & Macquarie She/Her
Posts Media Videos Starter Packs
mollyaclark.bsky.social
Aww such good times🥹and amazing work as always!!
mollyaclark.bsky.social
Thank you!☺️ and re the tracking, I’ve found what Christos describes to work well for other experiments, but the lighting and camera set up needs to be very consistent
mollyaclark.bsky.social
Our findings raise some interesting questions:

🧠Are some group personalities more resilient than others?
🐟How do predator and prey personalities interact?
🔈Could different types of noise have different impacts on shoals?

More info in paper📖

Thanks for reading!

6/6
mollyaclark.bsky.social
Our main finding was that groups showed stable personalities:
✅ Across acoustic noise and control treatments
✅ Across repeated trials

Repeatable group-level differences were seen across all behaviours measured

📊X = trial 1, Y = trial 2

5/6
Six scatterplots comparing behavioural metrics between first and second trials in both control (dark) and noise (light) conditions. Panels show: (a) mean speed, (b) group cohesion, (c) arm entries, (d) leadership proportion, (e) leadership attempts, and (f) following events. Points are scattered close to the diagonal x = y line, indicating similar values between trials.
mollyaclark.bsky.social
What we found:
📉 Shoals had fewer following events in the noise condition than the control

But we saw no clear change in leadership, swimming speed, or group cohesion

📊light = treatment, dark = control

4/6
Six-panel figure showing changes in guppy group behaviour over four days under added acoustic noise (light colours) and control (dark colours) treatments. Each panel shows a different metric: (a) average speed, (b) group cohesion, (c) arm movements, (d) leadership proportion, (e) leadership attempts, and (f) following events. Dots represent group data, with fitted trend lines and shaded 95% confidence intervals.
mollyaclark.bsky.social
We tested whether acoustic noise 📢 disrupts decision-making in guppy shoals using a 5-arm maze ⭐️

We expected added noise to interfere with group cohesion, exploration and leadership success

📸 image from tracking software

🔴fish attempting to lead

3/6
Overhead view of a five-armed arena used to test group decision-making in guppies. Four fish are visible, each with a coloured path tracing their movement: 1 (dark blue), 2 (light blue), 3 (yellow), and 4 (red). The arena is framed by a black circular tub and enclosed by white curtains.
mollyaclark.bsky.social
Decision-making allows fish shoals to coordinate movements and maintain the benefits of group-living, like avoiding predators 🐟

But acoustic noise can interfere - by disrupting how group members share information through masking, distraction, and stress

2/6
mollyaclark.bsky.social
Out now 🎉
The second paper from my Masters published in Scientific Reports!

We explored how acoustic noise affects collective behaviour in guppies 🐟

With fab co-authors: Ella Waples, @andyradford.bsky.social, Steve Simpson & @ccioannou.bsky.social

🔗 www.nature.com/articles/s41...

🧵1/6
Screenshot of the title and author list of a scientific paper published in Scientific Reports. The title reads: “Group personality, rather than acoustic noise, causes variation in group decision-making in guppy shoals.” Authors listed are Molly A. Clark, Ella Waples, Andrew N. Radford, Stephen D. Simpson, and Christos C. Ioannou.
Reposted by Molly Clark
amcell.bsky.social
2025. #DEI. You’re only human: a six-step strategy to surviving your PhD. Graduate students are not machines. Behaving like one during your programme will leave you frustrated and unfulfilled, says Gauthier Weissbart. www.nature.com/articles/d41...
You’re only human: a six-step strategy to surviving your PhD
Graduate students are not machines. Behaving like one during your programme will leave you frustrated and unfulfilled, says Gauthier Weissbart.
www.nature.com
Reposted by Molly Clark
chrisleduck.bsky.social
🐝 3-year Postdoc position 🐝

Join us @bristolbiosci.bsky.social to study the impacts of parasitic bees on tropical bee communities using eDNA, SNPs & field-based surveys.

📅 Deadline: 23 Feb 2025
💃Vibrant city
🌎 Collaboration with USP 🇧🇷
🐝 Details here: tinyurl.com/586u7vau

@leverhulme.bsky.social
Lestrimelitta robber bees standing on the entrance tube Melipona flavolineata stingless bee guards standing on their nest entrance tube
mollyaclark.bsky.social
Epic sunrise today from @bristolbiosci.bsky.social terrace, the best view spot in Bristol!🌅
mollyaclark.bsky.social
Thank you! I hope it was easy to follow😊
mollyaclark.bsky.social
Your field assistant, my emotional support animal🐶Thanks Costanza🥰
mollyaclark.bsky.social
Thanks to those who’ve helped me along the way, including Toby Champneys, Iestyn Penry-Williams and @collectiveecology.bsky.social, my MRes examiners @cbenvenuto.bsky.social and @mgenner.bsky.social, and special thanks to fellow pond enthusiast @coszan.bsky.social and her field assistant Ugo🐾

12/12
Me baiting a minnow trap for a pilot study, accompanied by Ugo the cockapoo
mollyaclark.bsky.social
Thanks for reading!🐟🏞️

On a personal note, it is very full circle to have this paper out 1 month before I move to Australia to start the second half of my PhD @ Macquarie University …

11/12
mollyaclark.bsky.social
Our concept can be applied more broadly to different species and modes of data collection e.g. camera traps for birds, light traps for insects, with new or existing data sets🦆🐝🐞🦋and we hope it can be useful to gain more #social insight from field experiments!

see discussion for more ideas👉💡

10/12
mollyaclark.bsky.social
Our method can also be used to look at phenotypic assortment in groups i.e. whether similar individuals are grouping together.

🐟🐟🐟vs🐟🐠🐡

9/12
mollyaclark.bsky.social
From our data we found fish were less aggregated when more red, breeding condition males were present #stickleback

8/12
Graph showing that the aggregation of fish decreased as the proportion of red breeding condition males increased.
mollyaclark.bsky.social
We also record environmental parameters to test whether environmental conditions were affecting how social sticklebacks are being, including: turbidity+🌡️+☀️

7/12
mollyaclark.bsky.social
As well as count data, we recorded the body length of each individual and whether they were in breeding condition (male sticklebacks turn red when in breeding condition!)

📈3 weeks of data collection at one site
a = aggregation score
🔴 = 100% red males
🟡 = 50% red males
⚪️ = 0% red males

6/12
A panel plot of the same pond 3 times labelled e, f, g. Coloured dots at 5 points of different sizes represent the number of fish caught at that trap, relative to one another. Colours range from red, to yellow, to white, a scale that indicates the number of red breeding condition males caught at that trap site. The n (number of fish caught) and a (aggregation score) are displayed for each panel. e is relatively aggregated with a couple of hot spots on the map, n = 114, a = 19; f is not very aggregated with a lot of red males, n = 12, a = 1; g is highlight aggregated with one major hotspot and few fish caught elsewhere, n = 130, a = 38.
mollyaclark.bsky.social
From count data, we calculate the index of dispersion to get an aggregation score. This tells us if fish tended to be more solitary or more social, which we could then compare to other variables…

5/12
mollyaclark.bsky.social
To overcome these challenges we use traditional ecology methods: a transect design and minnow traps, to collective information about the distribution of individuals in the population

4/12
A minnow trap next to a large pond.