


@reciting.bsky.social
Reposted

A paper on the probability words used in intelligence analysis. Each word is meant to relate to a specific probability range. But people interpret these words in varied ways. "Participants greatly overestimated the probability for realistic possibility"
www.tandfonline.com/doi/full/10....
www.tandfonline.com/doi/full/10....

March 28, 2025 at 9:50 AM
A paper on the probability words used in intelligence analysis. Each word is meant to relate to a specific probability range. But people interpret these words in varied ways. "Participants greatly overestimated the probability for realistic possibility"
www.tandfonline.com/doi/full/10....
www.tandfonline.com/doi/full/10....
Reposted

ANNOUNCE:
📊 I'm teaching my favorite course, _Psychology of Data Visualization_ again starting in Jan. Among other topics: #history of #dataviz, graph #perception, #rstats graphs, data journalism, ...
Course materials available at: friendly.github.io/6135/
I'll use the tag #psy6135 for posts
📊 I'm teaching my favorite course, _Psychology of Data Visualization_ again starting in Jan. Among other topics: #history of #dataviz, graph #perception, #rstats graphs, data journalism, ...
Course materials available at: friendly.github.io/6135/
I'll use the tag #psy6135 for posts
December 3, 2024 at 9:26 PM
ANNOUNCE:
📊 I'm teaching my favorite course, _Psychology of Data Visualization_ again starting in Jan. Among other topics: #history of #dataviz, graph #perception, #rstats graphs, data journalism, ...
Course materials available at: friendly.github.io/6135/
I'll use the tag #psy6135 for posts
📊 I'm teaching my favorite course, _Psychology of Data Visualization_ again starting in Jan. Among other topics: #history of #dataviz, graph #perception, #rstats graphs, data journalism, ...
Course materials available at: friendly.github.io/6135/
I'll use the tag #psy6135 for posts
Reposted

So @jbgruber.bsky.social's {rollama} #rstats package here is actually super super cool
![Screenshot from R with this code, running on an Ollama that's running locally through Docker Compose.
library(tidyverse)
library(rollama)
q <- tribble(
~role, ~content,
"system", "You assign text into categories. Answer in JSON format with the category, percent confidence, and your reasoning, in this structure: {'category': 'blah', 'confidence': 0.6, 'reasoning': 'blah'}",
"user", "text: The food was awful\ncategories: positive, neutral, negative"
)
answer <- query(q)
#> ✔ llama2 is thinking ⠇ [17.6s]
#>
#> ── Answer ──────────────────────────────────────────────────────────────
#> {'category': 'negative', 'confidence': 0.8, 'reasoning': 'The text explicitly states that the food was awful, which is a negative evaluation.'}](https://cdn.bsky.app/img/feed_thumbnail/plain/did:plc:2zcfjzyocp6kapg6jc4eacok/bafkreic2ganzblxy63wyynh6wtrr732ny5dsg4jr6zf6vzuf2h2mcjuitu@jpeg)
March 2, 2024 at 4:29 PM
So @jbgruber.bsky.social's {rollama} #rstats package here is actually super super cool
Reposted

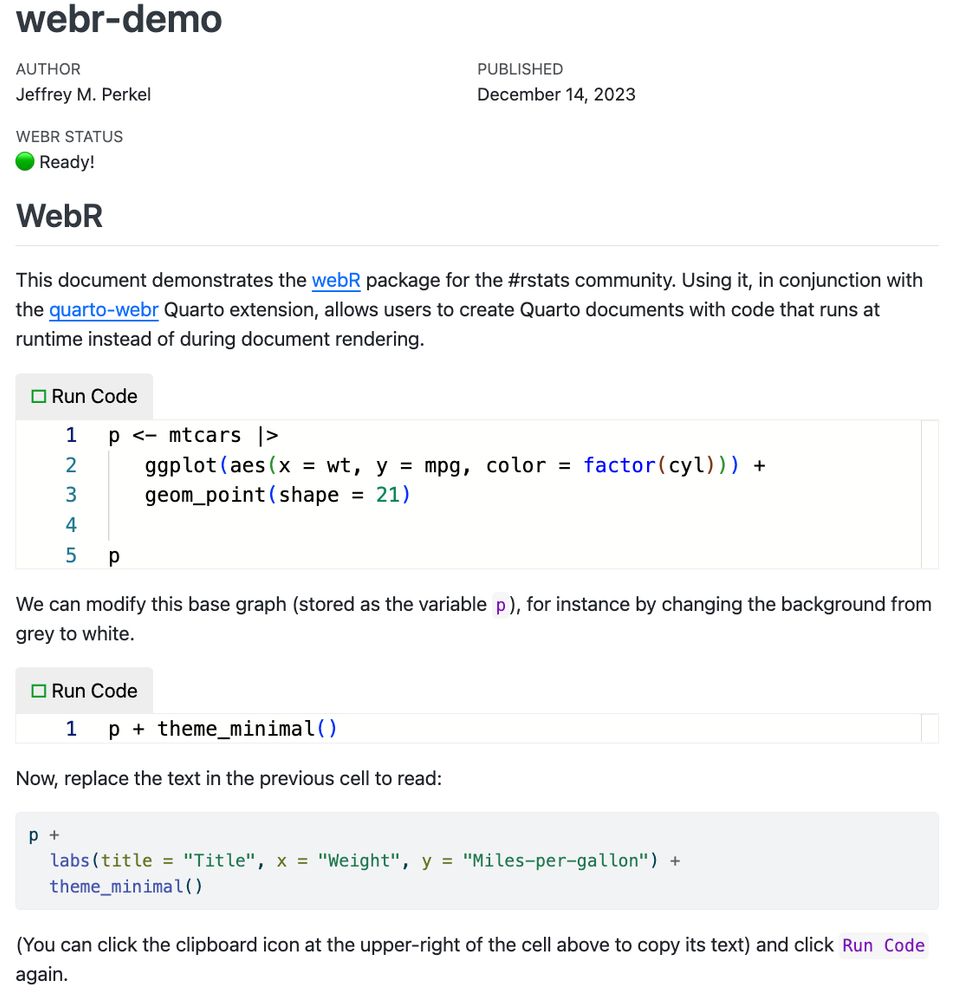
This is so cool. R running in the browser thanks to WebAssembly and {webR}, no installation required! Check it out! #Rstats jperkel.github.io
December 14, 2023 at 11:43 PM
This is so cool. R running in the browser thanks to WebAssembly and {webR}, no installation required! Check it out! #Rstats jperkel.github.io
Reposted

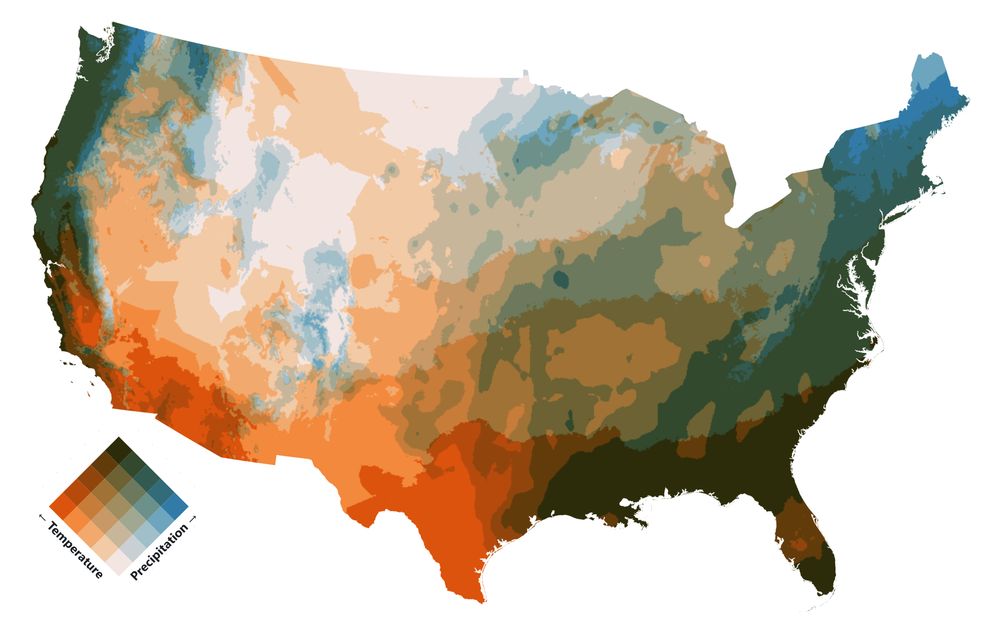
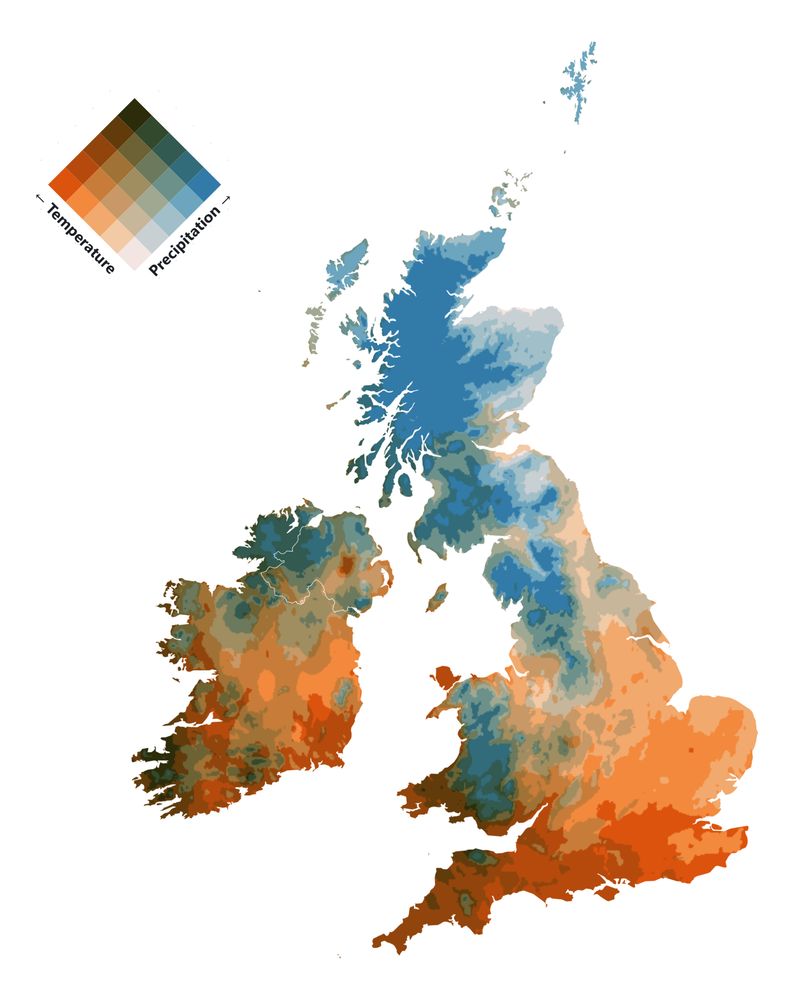
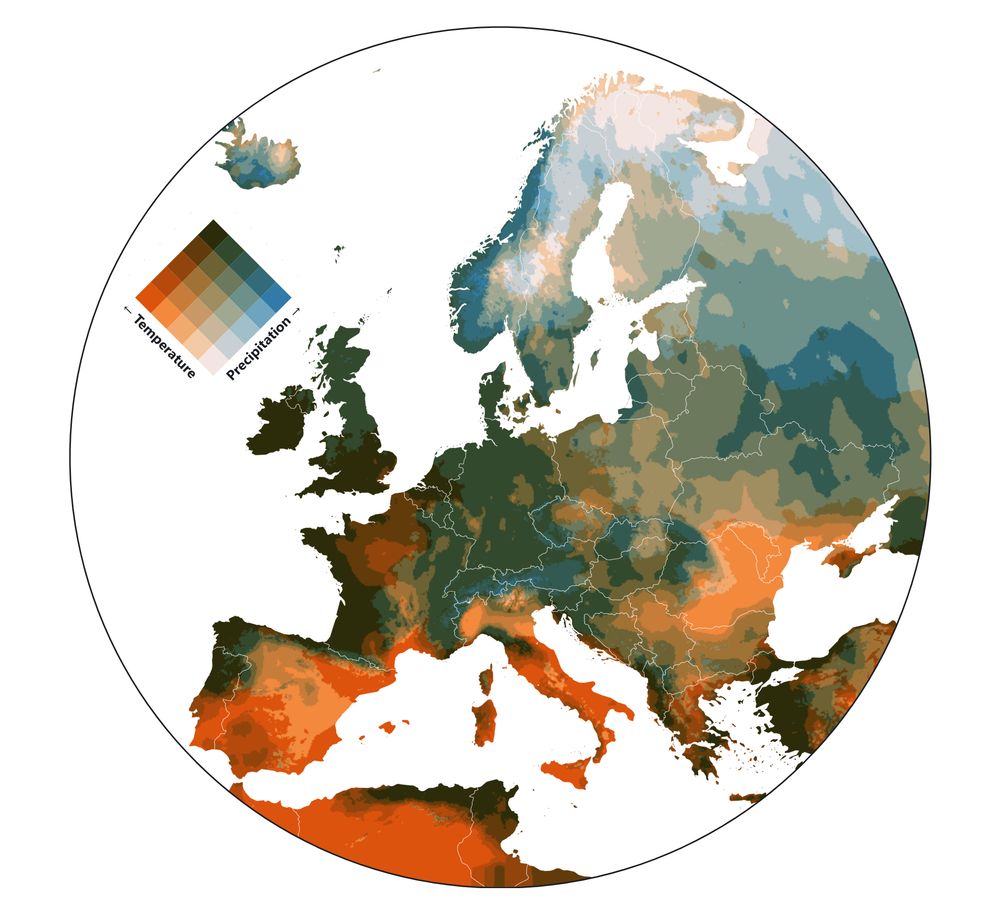
Bivariate maps showing the relationships between Temperature and Precipitation.
Made with Plot, based on a great tutorial by Fil: observablehq.com/@jo...
Data from TerraClimate (1958-present).
#cartography #maps #mapping #climate #dataviz #SciArt
Made with Plot, based on a great tutorial by Fil: observablehq.com/@jo...
Data from TerraClimate (1958-present).
#cartography #maps #mapping #climate #dataviz #SciArt
January 6, 2025 at 7:00 AM
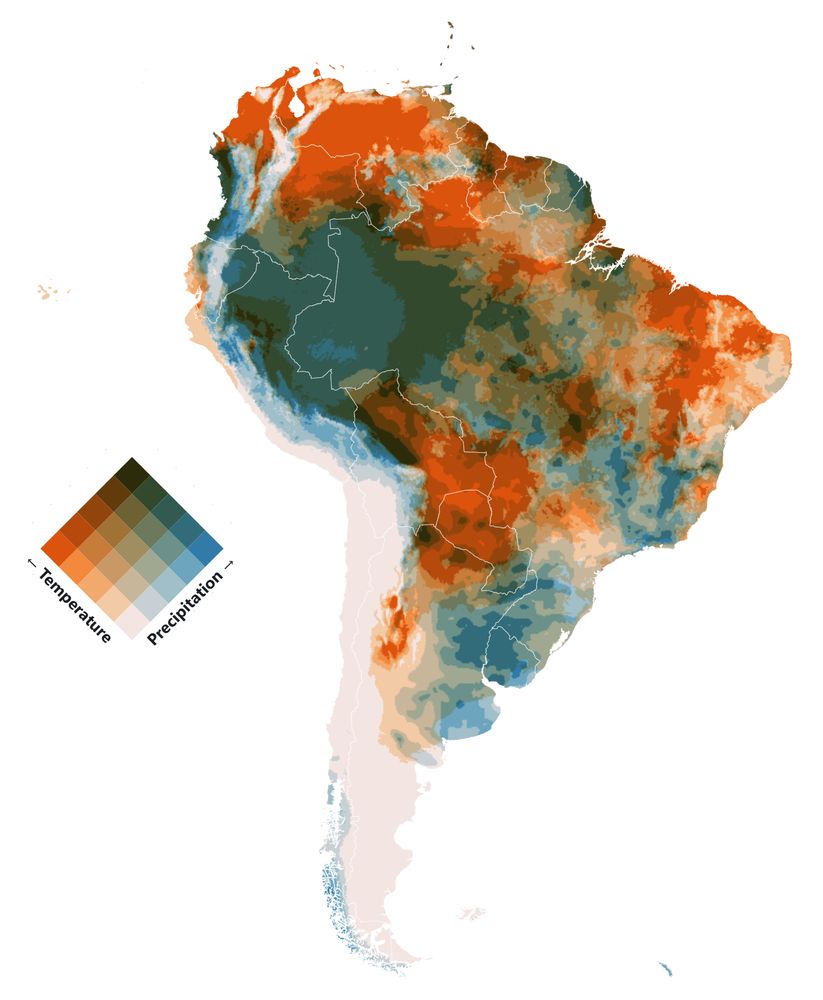
Bivariate maps showing the relationships between Temperature and Precipitation.
Made with Plot, based on a great tutorial by Fil: observablehq.com/@jo...
Data from TerraClimate (1958-present).
#cartography #maps #mapping #climate #dataviz #SciArt
Made with Plot, based on a great tutorial by Fil: observablehq.com/@jo...
Data from TerraClimate (1958-present).
#cartography #maps #mapping #climate #dataviz #SciArt