Johannes Schwenke
@schwenkej.bsky.social
160 followers 220 following 84 posts
MD | PhD Student in Clinical Epidemiology @UniBasel. | Supervisor: Matthias Briel #ClinicalTrials #RStats
Posts Media Videos Starter Packs
schwenkej.bsky.social
Not sure I wanted to know this.
schwenkej.bsky.social
Fwiw, I think it's fair to worry a lot about pretreatment confounders. But applying a study's results to the patient in front of me is an entirely different beast imo.
schwenkej.bsky.social
Thanks, added to my reading list. I never thought about DAGs and RCTs being exclusive. I would tend to include DAGs in RCTs protocols depending on the questions we want to answer.
schwenkej.bsky.social
I likely have a myopic view because I'm from healthcare...
schwenkej.bsky.social
I really like this paper a lot. But I would think that the causal specification is easier for RCTs if you plan up front? You could a priori specify causal and inert (ingredients) try to evaluate these quantitatively and qualitatively during the trial to improve generalization to another setting?
schwenkej.bsky.social
I'm not yet convinced. a) would depend on your question, right? Protocol deviations could be part of your estimand (treatment policy)? So you'd just need to collect the follow-up as intended, but that's the same for obs. b) also applies to non-randomized studies (you can't sample from the future..)
schwenkej.bsky.social
Rarely a day where I don't stare into an abyss of ignorance.
schwenkej.bsky.social
My University scrapped the only semester long causal inference course this semester :)
schwenkej.bsky.social
Thanks. I'm not very familiar with the AIPW, so is this just specific to AIPW or e.g. also applies to standardization? Aren't there all kinds of different clusters imaginable? Why just care about site?
schwenkej.bsky.social
There was a talk at ISCB about estimands for multicenter, but individual randomised trials and type I error inflation when not taking into account clustering. I think it was from Kelly van Lanckers group. I left very confused, because I thought concurrent control would deal with the issue.
schwenkej.bsky.social
Yes, I meant a mixture of informative prior + vague prior. I was just a bit confused that literally all (of the few) examples I've seen so far used change scores...
schwenkej.bsky.social
Just the expected weight at the end of the study?
schwenkej.bsky.social
This is likely a stupid question: in RCTs we prefer to model differences between groups in the raw outcomes, not change scores, for various reasons @f2harrell.bsky.social has laid out. So if I'm not borrowing on the 'control' effect, what would I borrow on then?
Reposted by Johannes Schwenke
dingdingpeng.the100.ci
Ever stared at a table of regression coefficients & wondered what you're doing with your life?

Very excited to share this gentle introduction to another way of making sense of statistical models (w @vincentab.bsky.social)
Preprint: doi.org/10.31234/osf...
Website: j-rohrer.github.io/marginal-psy...
Models as Prediction Machines: How to Convert Confusing Coefficients into Clear Quantities

Abstract
Psychological researchers usually make sense of regression models by interpreting coefficient estimates directly. This works well enough for simple linear models, but is more challenging for more complex models with, for example, categorical variables, interactions, non-linearities, and hierarchical structures. Here, we introduce an alternative approach to making sense of statistical models. The central idea is to abstract away from the mechanics of estimation, and to treat models as “counterfactual prediction machines,” which are subsequently queried to estimate quantities and conduct tests that matter substantively. This workflow is model-agnostic; it can be applied in a consistent fashion to draw causal or descriptive inference from a wide range of models. We illustrate how to implement this workflow with the marginaleffects package, which supports over 100 different classes of models in R and Python, and present two worked examples. These examples show how the workflow can be applied across designs (e.g., observational study, randomized experiment) to answer different research questions (e.g., associations, causal effects, effect heterogeneity) while facing various challenges (e.g., controlling for confounders in a flexible manner, modelling ordinal outcomes, and interpreting non-linear models).
Figure illustrating model predictions. On the X-axis the predictor, annual gross income in Euro. On the Y-axis the outcome, predicted life satisfaction. A solid line marks the curve of predictions on which individual data points are marked as model-implied outcomes at incomes of interest. Comparing two such predictions gives us a comparison. We can also fit a tangent to the line of predictions, which illustrates the slope at any given point of the curve. A figure illustrating various ways to include age as a predictor in a model. On the x-axis age (predictor), on the y-axis the outcome (model-implied importance of friends, including confidence intervals).

Illustrated are 
1. age as a categorical predictor, resultings in the predictions bouncing around a lot with wide confidence intervals
2. age as a linear predictor, which forces a straight line through the data points that has a very tight confidence band and
3. age splines, which lies somewhere in between as it smoothly follows the data but has more uncertainty than the straight line.
schwenkej.bsky.social
Okay, maybe it's this section that describes the analysis of the primary outcome(?) If you randomize 2000+ patients, are more details than 1 sentence too much to ask for?
schwenkej.bsky.social
I think it's unfortunate when a result publication omits crucial methods. The authors report a risk ratio, from the publication alone it's completely unclear how anything is calculated. They cite their SAP in which they state that they'll report odds ratios and use step-wise variable selection?!
Treatment efficacy and the predictors of the primary endpoint will be analyzed using a logistic regression model with stepwise selection
schwenkej.bsky.social
Being charitable, I'd assume they wanted a more precise estimate for the pearl-index of the mini IUD, therefore 4:1. Though imo that's less useful than if they had tried to show non-inferiority ... 🤷
schwenkej.bsky.social
Honestly, some choices I don't quite understand (judging by the abstract only). If the goal is really to compare mini vs normal IUD, then why 4:1 randomization ratio that'll wreck your power? Also a bit strange to not report pearl-index in this study / other studies of non-mini IUD for comparison?
nejm.org
NEJM.org @nejm.org · Aug 10
Among 887 participants using a mini copper intrauterine device (IUD) over 3 years, the cumulative rate of pregnancy was 4.8%. There were fewer adverse events leading to discontinuation with the mini than with a standard size copper IUD. Full article in NEJM Evidence: eviden.cc/44ZsUXK
A visual comparison of the NTCu380 Mini and TCu380A IUDs
schwenkej.bsky.social
Exciting! What's OpenPhil doing in clinical trials? Wasn't aware that they are supporting methods work.
schwenkej.bsky.social
@f2harrell.bsky.social I think the figures in one of your book chapters are broken. At least for me on two devices and two different browsers.

hbiostat.org/rmsc/markov
22  Semiparametric Ordinal Longitudinal Models – Regression Modeling Strategies
hbiostat.org
Reposted by Johannes Schwenke
andrew.heiss.phd
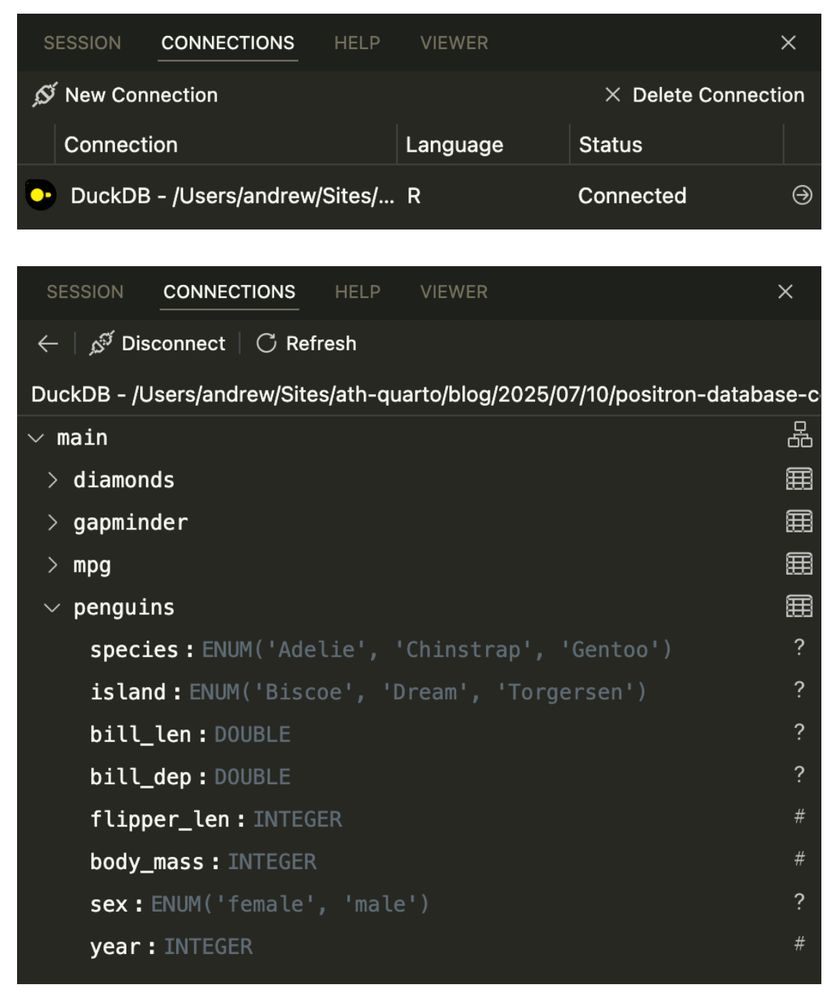
Another @posit.co Positron blog post! To make it easier to work with some huge data in one of my projects, I've loaded it into @duckdb.org. The Connections Pane makes it really easy and convenient to connect to and explore databases with #rstats. Here's how: www.andrewheiss.com/blog/2025/07...
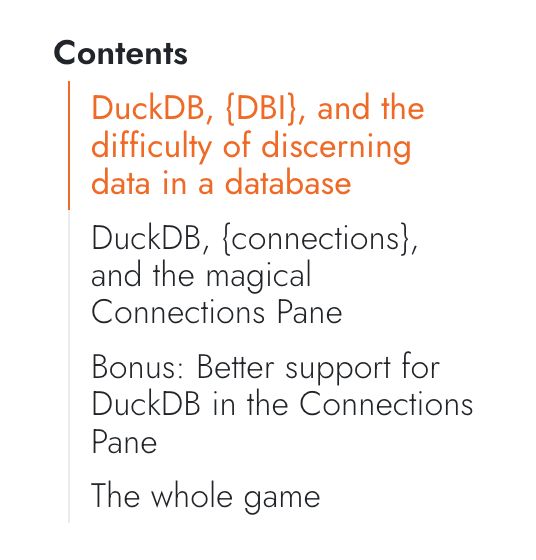
Screenshot of a connection to a DuckDB database, and a screenshot of the columns of one of the tables in that database Table of contents for the post:

- DuckDB, {DBI}, and the difficulty of discerning data in a database
- DuckDB, {connections}, and the magical Connections Pane
- Bonus: Better support for DuckDB in the Connections Pane
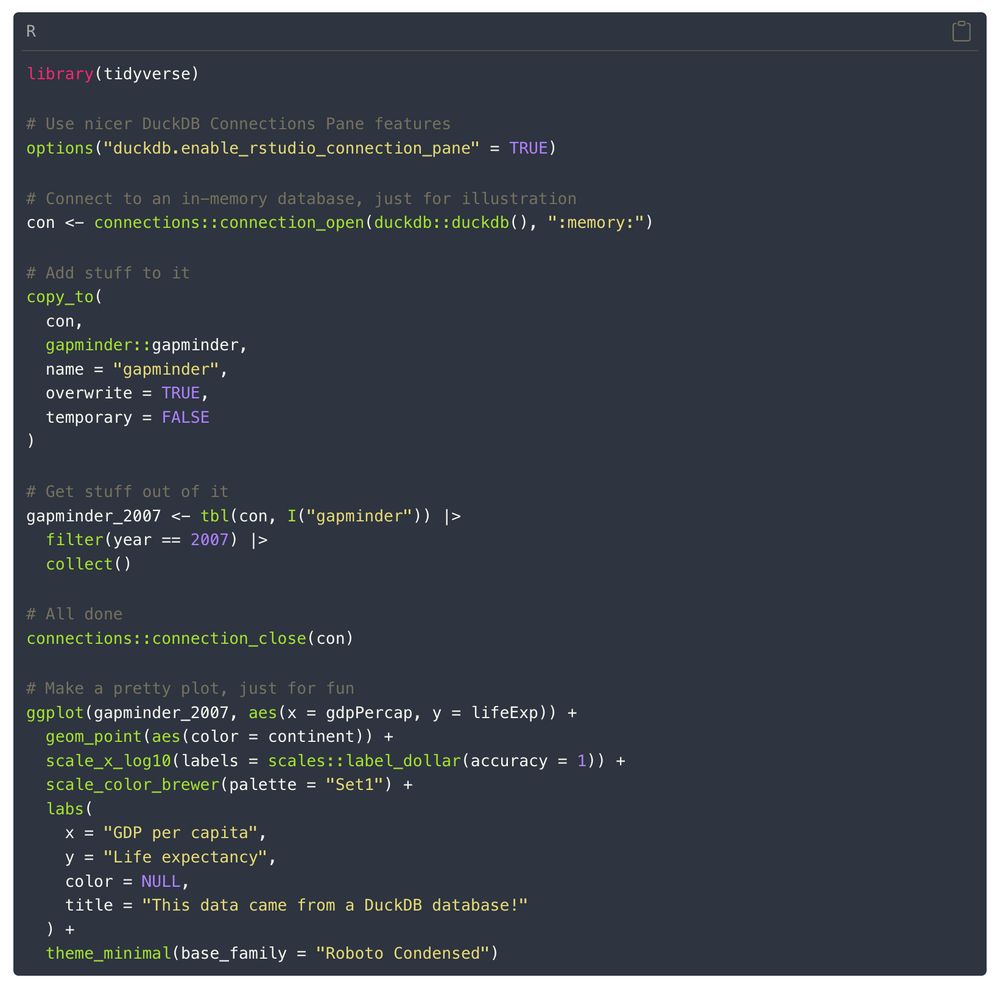
- The whole game R code for connecting to a database, adding stuff to it, extracting it, and plotting it

library(tidyverse)

# Use nicer DuckDB Connections Pane features
options("duckdb.enable_rstudio_connection_pane" = TRUE)

# Connect to an in-memory database, just for illustration
con <- connections::connection_open(duckdb::duckdb(), ":memory:")

# Add stuff to it
copy_to(
  con,
  gapminder::gapminder,
  name = "gapminder",
  overwrite = TRUE,
  temporary = FALSE
)

# Get stuff out of it
gapminder_2007 <- tbl(con, I("gapminder")) |>
  filter(year == 2007) |>
  collect()

# All done
connections::connection_close(con)

# Make a pretty plot, just for fun
ggplot(gapminder_2007, aes(x = gdpPercap, y = lifeExp)) +
  geom_point(aes(color = continent)) +
  scale_x_log10(labels = scales::label_dollar(accuracy = 1)) +
  scale_color_brewer(palette = "Set1") +
  labs(
    x = "GDP per capita",
    y = "Life expectancy",
    color = NULL,
    title = "This data came from a DuckDB database!"
  ) +
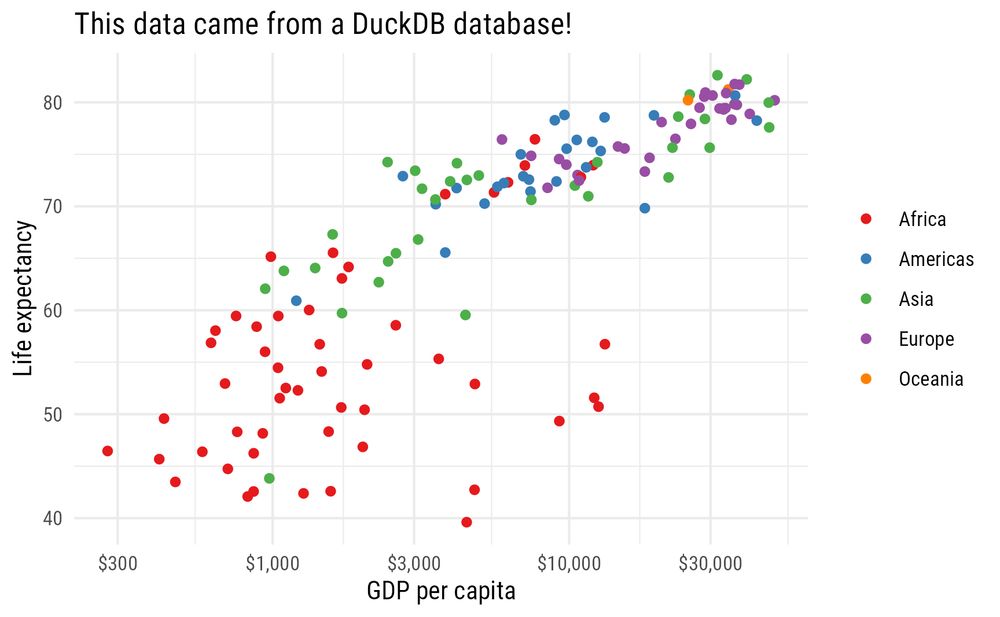
  theme_minimal(base_family = "Roboto Condensed") Scatterplot showing global health and wealth from gapminder in 2007
Reposted by Johannes Schwenke
ruben.the100.ci
Anyone got any reading tips for blogs or papers on
a) generalizability theory with brms
b) G theory + IRT (I have Choi's 2017 dissertation)?