


Abdoul
@abdoulma.bsky.social
Data visualization & System Programming

December 11, 2025 at 12:01 AM
Reposted by Abdoul

Big new blogpost!
My guide to data visualization, which includes a very long table of contents, tons of charts, and more.
--> Why data visualization matters and how to make charts more effective, clear, transparent, and sometimes, beautiful.
www.scientificdiscovery.dev/p/salonis-gu...
My guide to data visualization, which includes a very long table of contents, tons of charts, and more.
--> Why data visualization matters and how to make charts more effective, clear, transparent, and sometimes, beautiful.
www.scientificdiscovery.dev/p/salonis-gu...

December 9, 2025 at 8:28 PM
Big new blogpost!
My guide to data visualization, which includes a very long table of contents, tons of charts, and more.
--> Why data visualization matters and how to make charts more effective, clear, transparent, and sometimes, beautiful.
www.scientificdiscovery.dev/p/salonis-gu...
My guide to data visualization, which includes a very long table of contents, tons of charts, and more.
--> Why data visualization matters and how to make charts more effective, clear, transparent, and sometimes, beautiful.
www.scientificdiscovery.dev/p/salonis-gu...

December 9, 2025 at 6:22 PM

December 5, 2025 at 12:06 AM


Reposted by Abdoul

hahahaha just got an email from someone who was using Claude to generate a boilerplate #QuartoPub document and the LLM *used my name* as the author. The computers are literally trying to be me now 😂🤣🙃🫠

November 21, 2025 at 1:38 PM
hahahaha just got an email from someone who was using Claude to generate a boilerplate #QuartoPub document and the LLM *used my name* as the author. The computers are literally trying to be me now 😂🤣🙃🫠
Reposted by Abdoul

🦀 I've improved the implementation behind all the string formatting macros in Rust: println, panic, format, write, log::info, etc. (Everything using format_args!().) They will compile a bit faster, use a bit less memory while compiling, result in smaller binaries, and produce more efficient code! 🎉

November 13, 2025 at 1:31 PM
🦀 I've improved the implementation behind all the string formatting macros in Rust: println, panic, format, write, log::info, etc. (Everything using format_args!().) They will compile a bit faster, use a bit less memory while compiling, result in smaller binaries, and produce more efficient code! 🎉
Reposted by Abdoul

Typst 0.14 is out now! Get ready for production with accessibility, PDFs as images, character-level justification, and more. Learn about more of the highlights in Typst 0.14 in the thread below ⤵️

October 24, 2025 at 12:38 PM
Typst 0.14 is out now! Get ready for production with accessibility, PDFs as images, character-level justification, and more. Learn about more of the highlights in Typst 0.14 in the thread below ⤵️
Reposted by Abdoul

🍩 What if climate looked like a donut? 🌍
Here’s a bunch of cities turned into a sweet dataviz experiment.
🟡 → comfy zone
🔴 → hot
🔵 → cold
Why a donut? Let me explain 👇
Here’s a bunch of cities turned into a sweet dataviz experiment.
🟡 → comfy zone
🔴 → hot
🔵 → cold
Why a donut? Let me explain 👇
September 29, 2025 at 11:29 PM
🍩 What if climate looked like a donut? 🌍
Here’s a bunch of cities turned into a sweet dataviz experiment.
🟡 → comfy zone
🔴 → hot
🔵 → cold
Why a donut? Let me explain 👇
Here’s a bunch of cities turned into a sweet dataviz experiment.
🟡 → comfy zone
🔴 → hot
🔵 → cold
Why a donut? Let me explain 👇
Reposted by Abdoul

{tinytable} 0.14.0 for #RStats makes it super easy to draw tables in html, tex, docx, typ, md & png.
There are only a few functions to learn, but don't be fooled! Small 📦s can still be powerful.
Check out the new gallery page for fun case studies.
vincentarelbundock.github.io/tinytable/vi...
There are only a few functions to learn, but don't be fooled! Small 📦s can still be powerful.
Check out the new gallery page for fun case studies.
vincentarelbundock.github.io/tinytable/vi...


September 29, 2025 at 12:44 PM
{tinytable} 0.14.0 for #RStats makes it super easy to draw tables in html, tex, docx, typ, md & png.
There are only a few functions to learn, but don't be fooled! Small 📦s can still be powerful.
Check out the new gallery page for fun case studies.
vincentarelbundock.github.io/tinytable/vi...
There are only a few functions to learn, but don't be fooled! Small 📦s can still be powerful.
Check out the new gallery page for fun case studies.
vincentarelbundock.github.io/tinytable/vi...
Reposted by Abdoul

I'm exited to announce a new resource about making slides with quarto and revealjs. This book is the combination of all the work I have done in this area, reordered and polished up
There isn't a lot of new information yet, but this format allows me to add more easily
slidecrafting-book.com
#quarto
There isn't a lot of new information yet, but this format allows me to add more easily
slidecrafting-book.com
#quarto

September 24, 2025 at 4:12 PM
I'm exited to announce a new resource about making slides with quarto and revealjs. This book is the combination of all the work I have done in this area, reordered and polished up
There isn't a lot of new information yet, but this format allows me to add more easily
slidecrafting-book.com
#quarto
There isn't a lot of new information yet, but this format allows me to add more easily
slidecrafting-book.com
#quarto
Reposted by Abdoul

This week #TidyTuesday exploring a curated collection of recipes collected from Allrecipes website. I created donut chart subplots to look like plates and added a fork and knife image to each.
#pydytuesday #dataviz
#pydytuesday #dataviz

September 16, 2025 at 4:42 PM
This week #TidyTuesday exploring a curated collection of recipes collected from Allrecipes website. I created donut chart subplots to look like plates and added a fork and knife image to each.
#pydytuesday #dataviz
#pydytuesday #dataviz
Reposted by Abdoul

A shout out for @nrennie.bsky.social fab book on data viz! nrennie.rbind.io/art-of-viz/
The Art of Data Visualization with ggplot2
nrennie.rbind.io
September 5, 2025 at 11:17 AM
A shout out for @nrennie.bsky.social fab book on data viz! nrennie.rbind.io/art-of-viz/
Reposted by Abdoul

At @okfn.bsky.social we are looking for a short-term R Developer. The work is exciting and important, advancing a humanitarian mission! Apply or share with others!

Senior R Developer – Jobs & Opportunities – Open Knowledge Foundation
okfn.org
September 3, 2025 at 1:06 PM
At @okfn.bsky.social we are looking for a short-term R Developer. The work is exciting and important, advancing a humanitarian mission! Apply or share with others!
Reposted by Abdoul

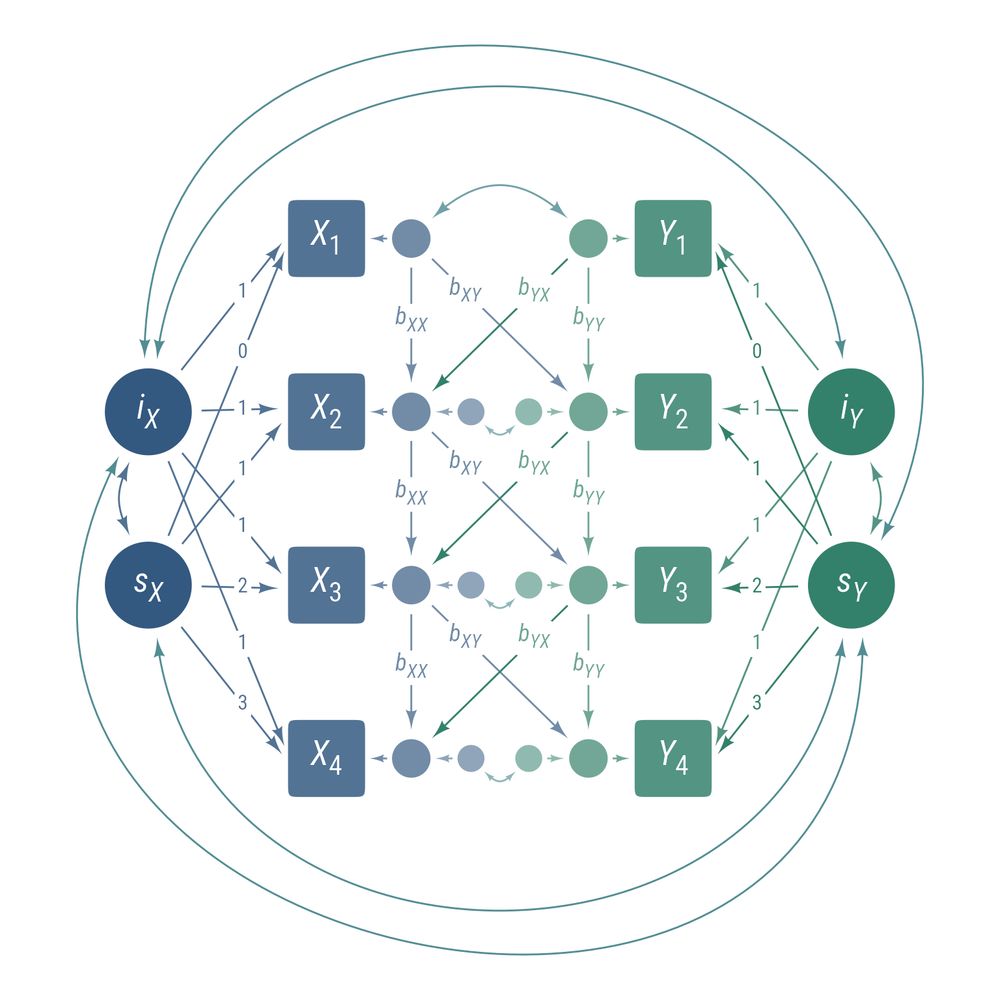
Now on CRAN, ggdiagram is a #ggplot2 extension that draws diagrams programmatically in #Rstats. Allows for precise control in how objects, labels, and equations are placed in relation to each other.
wjschne.github.io/ggdiagram/ar...
wjschne.github.io/ggdiagram/ar...


August 20, 2025 at 10:43 AM
Now on CRAN, ggdiagram is a #ggplot2 extension that draws diagrams programmatically in #Rstats. Allows for precise control in how objects, labels, and equations are placed in relation to each other.
wjschne.github.io/ggdiagram/ar...
wjschne.github.io/ggdiagram/ar...
Reposted by Abdoul
See the latest version here! datavizs25.classes.andrewheiss.com
August 12, 2025 at 10:12 PM
See the latest version here! datavizs25.classes.andrewheiss.com